Strip-Plot Design
A strip-plot design applies two factors in perpendicular strips across each block, so that both factors occupy large units and their combinations arise at the intersections. This tutorial explains where the design comes from, why it carries three separate error terms, and how to run the whole analysis in RAISINS… Read more …
A strip-plot design, also called a split-block or crisscross design, is used when two treatment factors must both be applied to large strips of experimental units. One factor is assigned to horizontal strips and the other to vertical strips. Their treatment combinations are obtained at the points where the strips intersect.
Because the two factors are applied to different sets of strips, the analysis has three error terms. Each error term is used to test a different part of the experiment. This tutorial explains the design, the three error terms, the analysis, and the interpretation of results. It also shows how the complete analysis can be performed in RAISINS.
1 Understanding the Strip-Plot Design
A strip-plot design, also called a split-block or crisscross design, is a factorial design used when both treatment factors require relatively large experimental units. The two factors are applied in different directions, usually as horizontal and vertical strips.
In an ordinary factorial experiment, all treatment combinations can be randomly assigned to individual plots. This may not be possible when treatments require machinery, irrigation channels, or other operations that must cover a larger area.
A split-plot design is appropriate when only one factor requires large units. A strip-plot design is used when both factors require large units.
1.1 Why is a strip-plot design needed?
Consider a field experiment with two methods of land preparation and three irrigation levels.
Suppose land preparation requires machinery that moves across a large area, while irrigation is supplied through channels that also extend across the field. Applying either treatment to small individual plots would therefore be difficult.
The strip-plot design provides a suitable arrangement. The land-preparation treatments are assigned to horizontal strips, while the irrigation treatments are assigned independently to vertical strips. The six treatment combinations are formed at the intersections of these strips.
Thus, the design allows both factors and their interaction to be studied while taking account of the practical requirements of treatment application.
Key principle: When both factors require large experimental units, the strip-plot design provides a practical way to investigate their main effects and interaction within a blocked factorial framework.
1.2 Structure and randomisation of a strip-plot experiment
The defining feature of a strip-plot experiment is its two-directional strip arrangement. Within each replication:
- the levels of factor A are randomly assigned to horizontal strips;
- the levels of factor B are independently assigned to vertical strips; and
- every level of factor A crosses every level of factor B exactly once.
The resulting intersections represent the factorial treatment combinations. For example, suppose factor A has two levels, R1 and R2, while factor B has three levels, C1, C2, and C3. One replication contains two horizontal strips and three vertical strips. Their intersections produce six treatment combinations:
\[ R1C1, \quad R1C2, \quad R1C3, \quad R2C1, \quad R2C2, \quad R2C3. \]
An important point is that these treatment combinations are not independently randomised to the individual intersection plots. They arise automatically from the crossing of the randomly assigned row and column strips. This distinction is fundamental to understanding the subsequent analysis.
A strip-plot experiment therefore contains three levels of experimental structure:
- Row strips - the experimental units to which factor A is applied.
- Column strips - the experimental units to which factor B is applied.
- Intersections - the smaller units formed by the crossing of the row and column strips.
Consequently, the three types of comparisons are associated with different sources of experimental variation. A comparison among levels of factor A is based on variation among row strips. A comparison among levels of factor B is based on variation among column strips. In contrast, comparisons among treatment combinations and the A x B interaction are based on variation among the intersection units. This hierarchical structure is the fundamental reason why a strip-plot analysis requires three separate error terms.
1.3 Visualising the strip-plot layout
Figure 1 shows one replication of a strip-plot experiment. The row factor is assigned to horizontal strips and the column factor to vertical strips. Their intersections form the treatment combinations.
The order of the strips may differ between replications because randomisation is performed separately within each replication. For analysis, the dataset records the row treatment, column treatment, replication, and response variable.
2 The three error terms and the analysis of variance
The three-error structure is the most important statistical feature of the strip-plot design.
In a completely randomised factorial experiment, all treatment combinations are assigned to experimental units of the same type, so a common residual error can generally be used to test the effects. In a strip-plot design, however, the observations do not all have the same experimental status. The variation associated with horizontal strips is different from the variation associated with vertical strips, and both differ from the residual variation among the intersection units. The analysis therefore distinguishes three errors, one for each of the three kinds of experimental unit set out above.
Error(A), the error for the row factor. Factor A is applied to the horizontal strips. Consequently, its levels must be compared using the variation among horizontal strips within replications:
\[ F_A = \frac{MS_A}{MS_{Error(A)}}. \]
Error(B), the error for the column factor. Factor B is applied to the vertical strips. Its levels are therefore evaluated against the variation among vertical strips within replications:
\[ F_B = \frac{MS_B}{MS_{Error(B)}}. \]
Error(C), the error for the interaction. The A x B interaction is expressed at the intersection of the two strips, and is therefore evaluated using the residual variation among the intersection units:
\[ F_{AB} = \frac{MS_{AB}}{MS_{Error(C)}}. \]
The three error terms are not interchangeable. Each represents a different component of experimental variation and is associated with a specific part of the experimental structure.
Central statistical principle: In a strip-plot design, each source of treatment variation must be compared with the error term corresponding to the experimental unit on which that treatment is applied.
2.1 Factors, replications, and number of observations
Suppose factor A has \(a\) levels, factor B has \(b\) levels, and the experiment has \(r\) replications. Each replication contains \(a\) row strips and \(b\) column strips. Because every row strip intersects every column strip, each replication contains \(a \times b\) intersection units, and the total number of observations is
\[ \boxed{N = abr} \]
For an experiment with \(a = 2\), \(b = 3\) and \(r = 4\), the total is
\[ N = (2)(3)(4) = 24. \]
Thus, the example dataset used throughout this tutorial contains 24 observations representing six treatment combinations evaluated across four replications.
2.2 Degrees of freedom
The ANOVA structure of a strip-plot design reflects its three distinct sources of experimental error. For a design with \(a\) levels of factor A, \(b\) levels of factor B, and \(r\) replications, the relevant degrees of freedom are as follows, with the right-hand column giving the values for the \(2 \times 3 \times 4\) example.
| Source of variation | Degrees of freedom | Error term | df in the example |
|---|---|---|---|
| Replication | \(r-1\) | - | 3 |
| Row factor (A) | \(a-1\) | Error(A) | 1 |
| Error(A) | \((r-1)(a-1)\) | - | 3 |
| Column factor (B) | \(b-1\) | Error(B) | 2 |
| Error(B) | \((r-1)(b-1)\) | - | 6 |
| A x B interaction | \((a-1)(b-1)\) | Error(C) | 2 |
| Error(C) | \((r-1)(a-1)(b-1)\) | - | 6 |
| Total | \(N-1\) | 23 |
The total degrees of freedom are
\[ 3 + 1 + 3 + 2 + 6 + 2 + 6 = 23, \]
which agrees with \(N - 1 = 24 - 1 = 23\). This provides an important internal check on the ANOVA decomposition.
2.3 Precision in a strip-plot design
The experimental structure also determines the relative precision with which the different effects can be estimated. The main effects of A and B are evaluated using variation among relatively large strip units. In contrast, the A x B interaction is evaluated using the smaller intersection units. Consequently, the strip-plot design generally provides greater precision for estimating the interaction than for estimating the individual main effects.
This is an important consideration when selecting an experimental design. If both factors can be applied and randomised independently to small experimental units, a conventional factorial design will generally provide greater precision for estimating the main effects. A strip-plot design becomes particularly appropriate when operational constraints require both factors to be applied in strips, or when the interaction between the two factors is of particular scientific interest.
Thus, the strip-plot design should not be viewed simply as a modified factorial design. Its experimental structure determines the precision of the different effects and, consequently, the appropriate statistical analysis.
2.4 Interpreting the three error terms
The three error terms can be understood in terms of the experimental questions they answer:
| Experimental question | Appropriate error term | Interpretation |
|---|---|---|
| Does factor A affect the response? | Error(A) | Variation among row strips |
| Does factor B affect the response? | Error(B) | Variation among column strips |
| Does the effect of A depend on B? | Error(C) | Variation among intersection units |
This distinction should be kept in mind when interpreting the ANOVA table. A significant F-test for factor A is meaningful only when factor A has been tested against Error(A); similarly, factor B must be tested against Error(B), and the A x B interaction against Error(C).
2.5 Mean comparison and critical differences
The use of three error terms also affects post-hoc mean comparisons. Because each effect is associated with a different source of experimental error, separate critical differences are required:
- CD (A) - for comparing levels of the row factor;
- CD (B) - for comparing levels of the column factor; and
- CD (A x B) - for comparing treatment combinations.
These critical differences are calculated using the corresponding error mean square and degrees of freedom. Therefore, a critical difference calculated for factor A should not be used to compare factor B levels or treatment combinations. Each comparison must be based on the error term appropriate to the experimental unit involved. Section 8.1 returns to this point beside the tables in which the three critical differences are actually reported.
3 Getting to the module
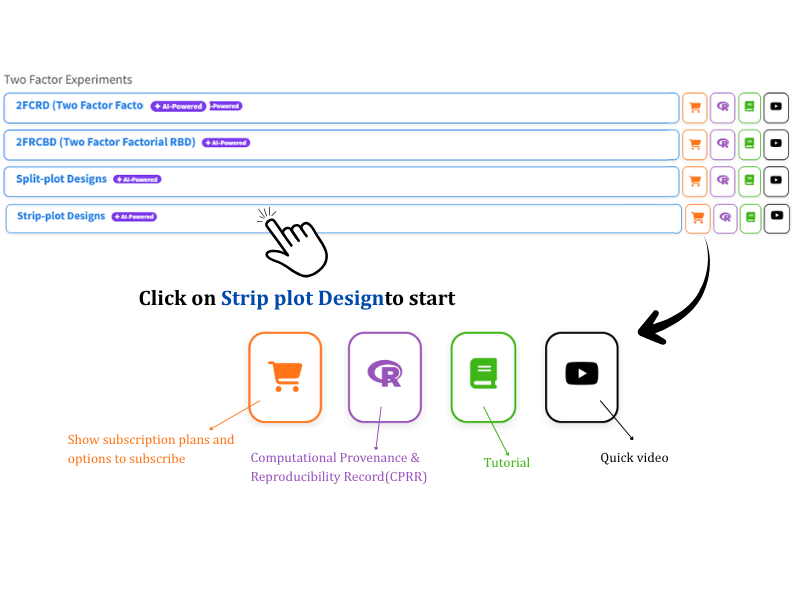
Now that the design is clear, let us run the analysis. Visit the RAISINS home page at www.raisins.live and open the Analysis of experiment section. Scroll to the group of two-factor experiments, to locate Strip-plot Designs and click it to start (Figure 2). No programming is required: you upload your data, point RAISINS at the row-treatment column, the column-treatment column, the replication column and the response columns, and it produces every table, plot and interpretation for you.
The module list includes four useful icons. The cart shows subscription plans, the R icon opens the Computational Provenance & Reproducibility Record, the book opens this tutorial, and the play button opens a video walkthrough.
3.1 Computational Provenance & Reproducibility Record
CPRR (Computational Provenance & Reproducibility Record) provides a transparent and comprehensive record. Click the CPRR icon shown in Figure 2 to see the exact computational workflow behind the analysis. The record for this module states the R version and the exact version of every package used, and names the specific function behind each reported result. CPRR lists every default parameter and decision rule applied by the module, including how the three error terms are formed and which of them enters each critical difference, and provides fully runnable R code that reproduces each analytical step. Users can execute the code in R to independently reproduce and verify the results. It carries its own DOI.
To cite the platform itself in a paper, thesis, or report, use the RAISINS citation, available in APA, Harvard, and BibTeX formats at www.raisins.live/citation.html. That is the primary reference, and for most manuscripts it is all you need.
The CPRR for the strip-plot module is at www.raisins.live/module_record/strip.html.
Cite the RAISINS paper as your primary reference for the platform. Add the CPRR as supporting documentation when a journal asks for details of the computing environment, or when you want your methods section to be precise about versions and functions rather than saying “analysis was carried out using an online tool.” The CPRR supports the citation and ensures computational reproducibility.
4 Preview mode and Quick Tour
Before subscribing, you can explore the entire module using Preview mode, accessible from the Welcome page. Preview mode loads a built-in strip-plot dataset so you can try every feature, the three-storey ANOVA, the row and column mean tables, the interaction table, the two-way tables, the basic and advanced plots, the PCA index and the RA-One assistant, without uploading your own data. First-time users are also offered a Quick Tour, an interactive, step-by-step walkthrough that highlights each control and explains what it does. You can retake the tour at any time from the Quick Tour tab, which sits at the right-hand end of the navigation bar visible in Figure 5.
5 A working example
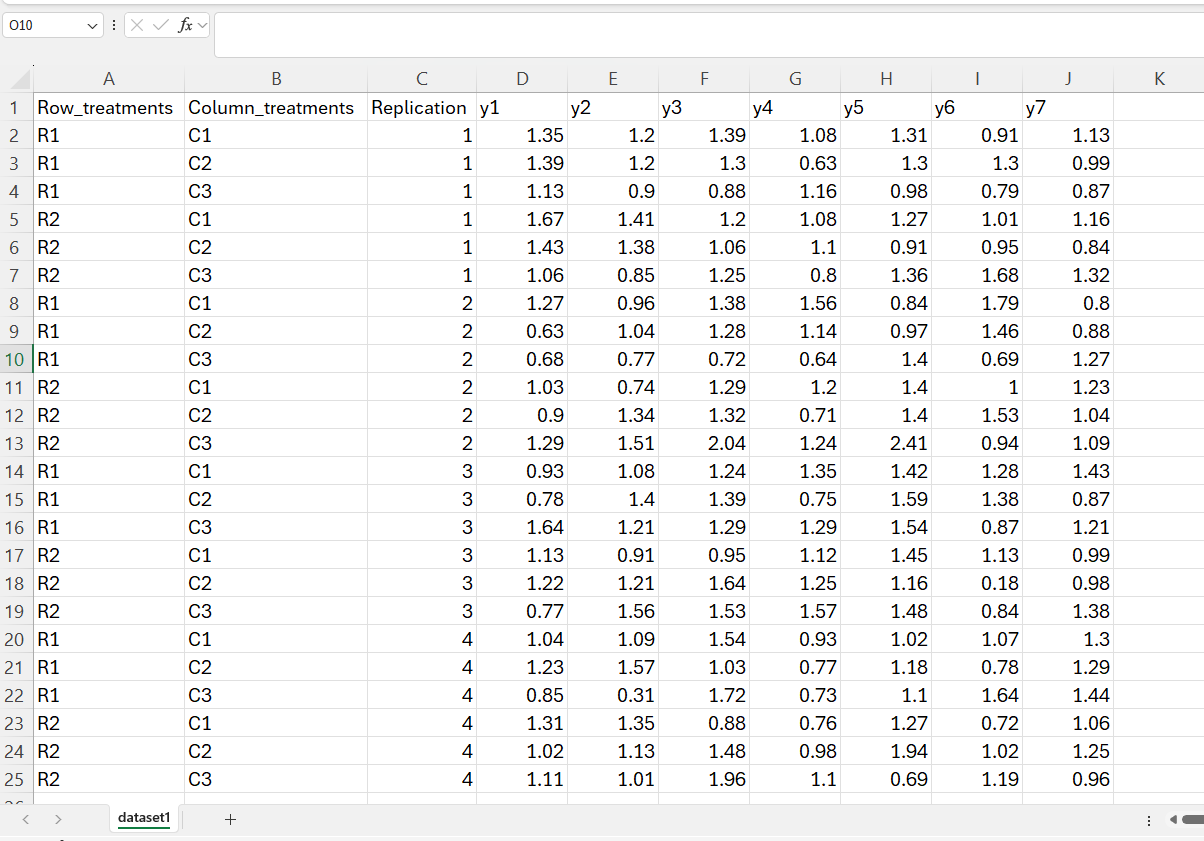
The rest of this tutorial follows one dataset, shown in Figure 3. It is a strip-plot experiment with Row_treatments as factor A at 2 levels (R1, R2), Column_treatments as factor B at 3 levels (C1, C2, C3), and 4 replications, giving \(2 \times 3 \times 4 = 24\) observations, one per line of the file. The layout is exactly the one drawn in Figure 1, repeated four times.
The first three columns hold the row-treatment label, the column-treatment label and the replication number; every remaining column is a response. Seven traits were recorded at each intersection, y1 through y7, and the analysis reported throughout this tutorial uses the first four of them, y1, y2, y3 and y4, all analysed together in a single run. The first line of the file records the intersection at which row treatment R1 met column treatment C1 in replication 1, with a y1 of 1.35, a y2 of 1.20 and a y3 of 1.39.
The question the module will settle is whether each trait depends on the row treatment, on the column treatment, and, above all, on their interaction, with each of those three questions judged against the error term that properly belongs to it.
This dataset ships with the module as Dataset 1 on the Datasets tab (Section 6.3). If you want to follow the tutorial exactly, download it there and upload it under Analysis.
6 How to prepare your data
Correct data preparation is essential for a reliable analysis. RAISINS provides four ways to prepare the dataset:
- Create your dataset in MS Excel
- Build your dataset directly within the RAISINS app
- Use the Model datasets in RAISINS as a reference
- Create your dataset using the RA-One chat assistant
6.1 Preparing data in MS Excel
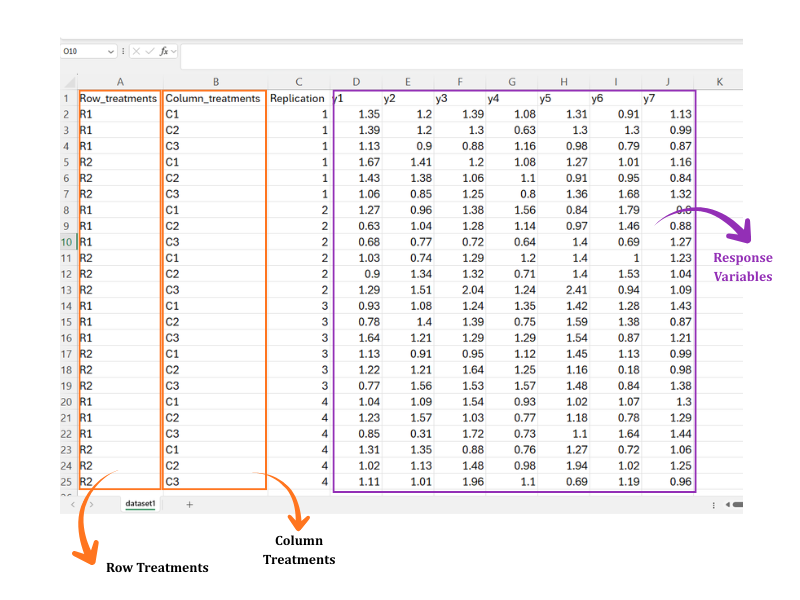
Lay the file out exactly as in Figure 3: the first column holds the row-treatment levels (here Row_treatments, with levels R1 and R2), the second column the column-treatment levels (here Column_treatments, with levels C1, C2 and C3), the third column the replication (here Replication, numbered 1 to 4), and each further column is one response variable (y1, y2, y3, …). Every line is one intersection, the small rectangle where a row strip crosses a column strip, so a file for a \(2 \times 3 \times 4\) experiment has 24 data lines beneath the header.
Every row treatment must meet every column treatment exactly once inside every replication. That complete crossing within each block is what defines the design, and it is what allows the three error terms to be separated from one another.
Dataset creation rules
- Column naming convention
- No spaces allowed in column names.
- Use underscores (
_) or full stops (.) for separation. - Avoid symbols and special characters such as %, #.
- Data arrangement
- Start the data towards the upper-left corner.
- Ensure the row above the data is not blank.
- Cell management
- Avoid typing or deleting in cells without data.
- If needed, select the affected cells, right-click, and choose Clear Contents.
- Row, column, replication and response columns
- The first three columns must be the row-treatment factor, the column-treatment factor and the replication; every remaining column is a numeric response.
- Use the same label for a level everywhere it appears, so RAISINS reads the correct number of levels and replications.
- Record the factors in the direction they were actually applied in the field, and keep that assignment fixed for the whole file.
- The crossing must be complete
- Each row treatment meets each column treatment once in every replication, giving \(a \times b\) lines per replication. Do not average over replications into a single line, and do not omit an intersection; the design must stay balanced for the three error terms and their critical differences to be exact.
How to save as CSV in MS Excel
Open your workbook. Ensure your data is arranged properly with only one sheet.
Click the ‘File’ menu. Go to the top-left corner and click File.
Choose ‘Save As’ or ‘Save a Copy’. Select the location where you want to save your file.
Set file type to CSV. In the ‘Save as type’ dropdown, choose CSV (Comma delimited) (*.csv).
Name your file. Enter a relevant file name without spaces (use underscores if needed).
Click ‘Save’. Click Save to export the file.
Tip: Before saving, double-check that your data is on the first sheet and follows the required format.
6.2 Prepare using Create Data in RAISINS
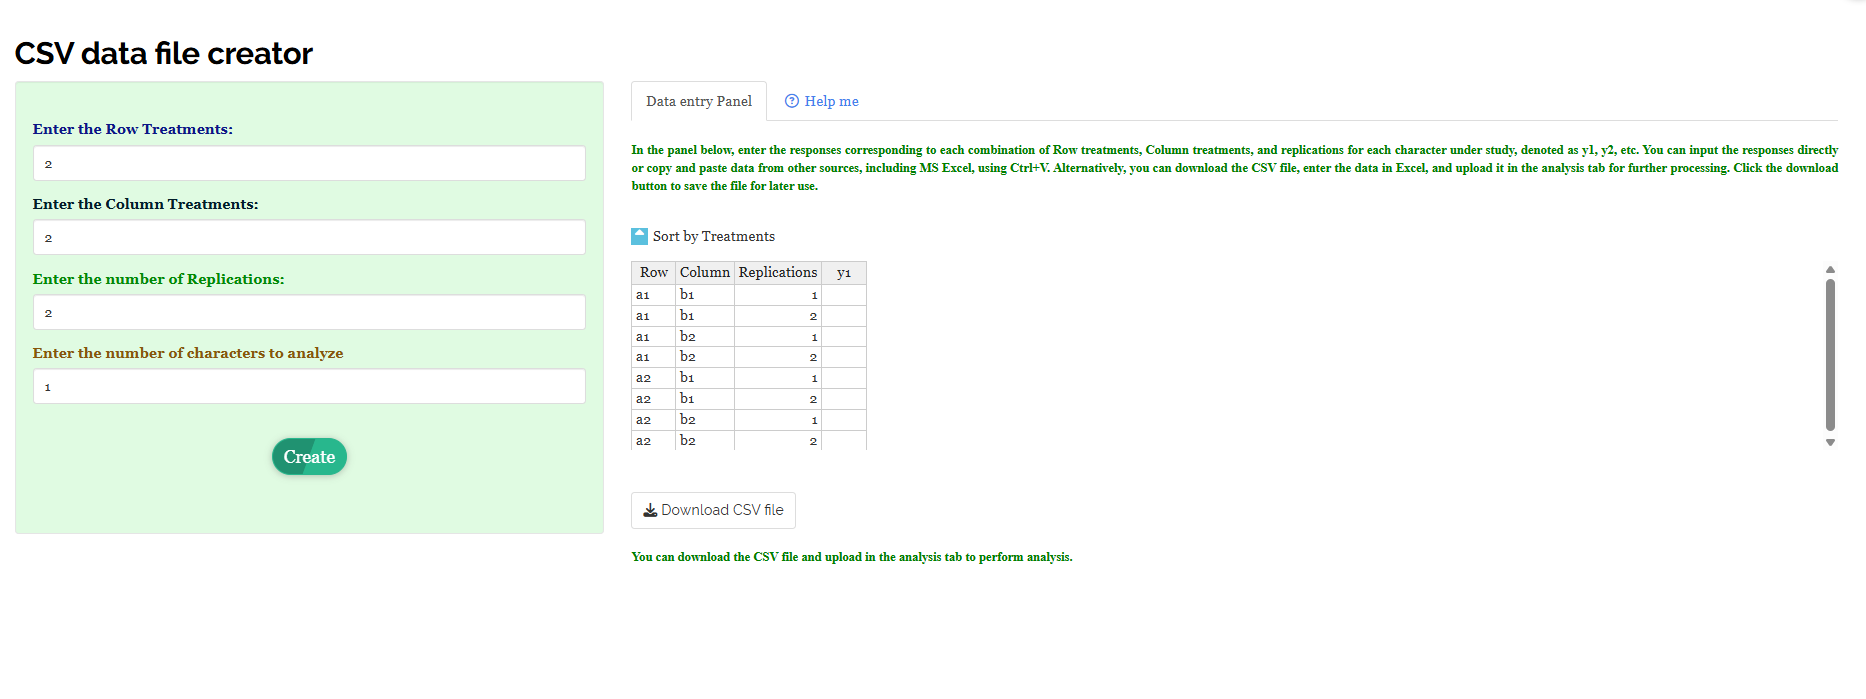
If you are unsure about the correct format, RAISINS can build the layout for you. Open the Create Data tab, which opens the CSV data file creator, and fill in four boxes (Figure 4):
- Enter the Row Treatments - how many levels the row factor has,
- Enter the Column Treatments - how many levels the column factor has,
- Enter the number of Replications - how many times the whole layout is repeated,
- Enter the number of characters to analyze - how many response variables you plan to measure.
Click Create, and the Data entry Panel on the right fills with one line for every row by column by replication combination, with empty response columns (y1, y2, …) waiting for your readings. Enter the values by hand, or paste a column straight from Excel . The Sort by Treatments toggle groups the lines so that all replications of a combination sit together, which is the easiest order to type into from a field book; the line order never affects the analysis. When the table is complete, click Download CSV file and upload it under the Analysis tab.
6.3 Download the Model datasets
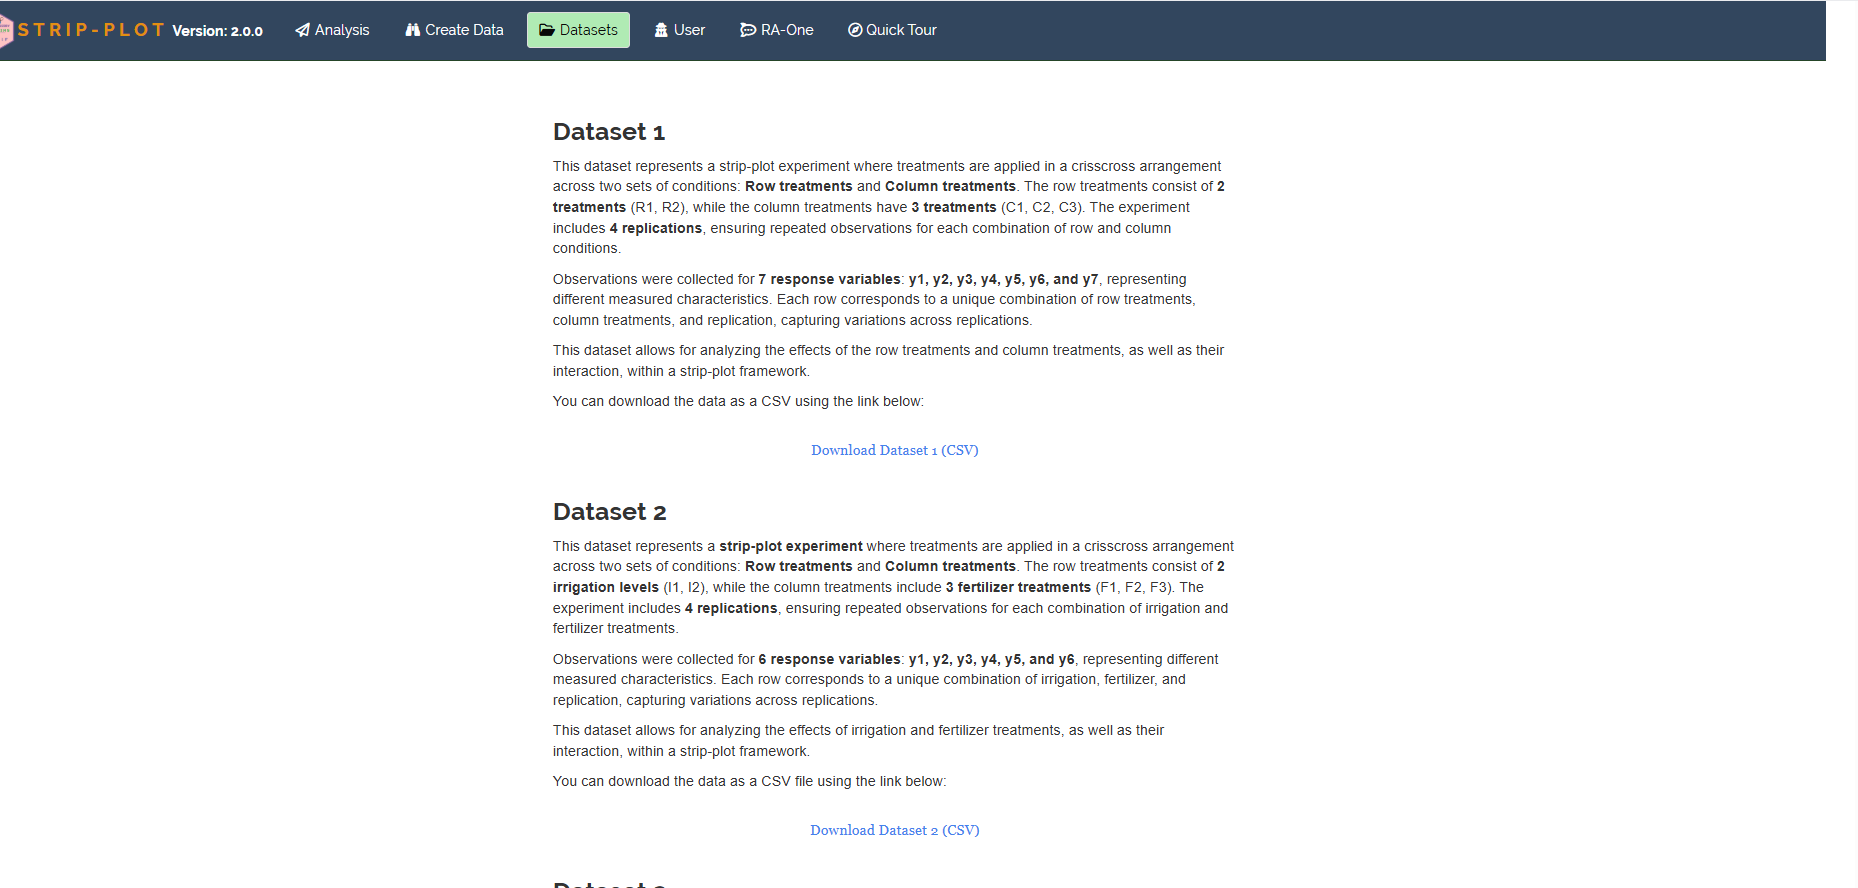
If you would like to explore the module before using your own data, RAISINS provides model datasets on the Datasets tab (Figure 5), each described in full before you download it. Dataset 1 is the file used throughout this tutorial: 2 row treatments (R1, R2), 3 column treatments (C1, C2, C3), 4 replications and 7 response variables y1 to y7. also along with this 2 more dataset is available in this tab, To use one:
- Open the Datasets tab
- Read the description and click the Download Dataset (CSV) link beneath it
- Save the file, then either study its layout as a reference for your own file or upload it directly under Analysis to see the full analysis at once
6.4 Creating a dataset using RA-One chat
RA-One, the built-in chat assistant, can build a correctly formatted template through an ordinary conversation. Open the RA-One tab and describe your experiment in plain language, for instance “Create data for 3 Horizontal Strip levels, 4 Vertical Strip levels, 3 blocks, 2 variables” (Figure 6 (a)). RA-One returns a ready-to-fill template with one line per intersection, the Row Treatments and Column Treatments columns already filled in, and empty y1, y2 columns for your readings (Figure 6 (b)).


7 The Analysis tab
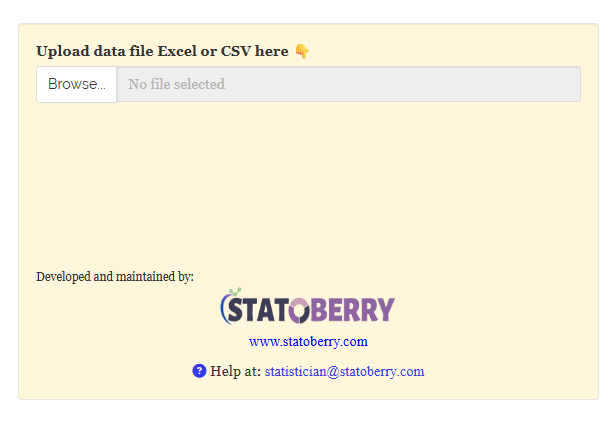
With your CSV ready, open the Analysis tab. The first step is to upload the file: click Browse… under Upload data file Excel or CSV here and select your CSV (Figure 7). A blue Upload complete bar confirms the file has loaded.
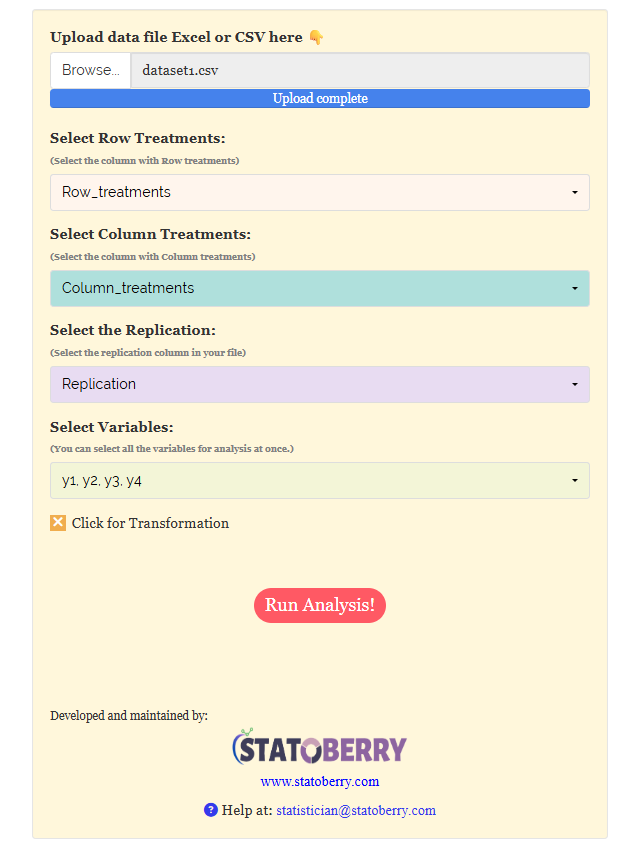
Once the file is in, RAISINS reads its column names and asks you to point it at the right columns (Figure 8). The four selectors follow the structure of the design exactly:
- Select Row Treatments - the column holding the row-strip levels; here
Row_treatments, with levels R1 and R2. - Select Column Treatments - the column holding the column-strip levels; here
Column_treatments, with levels C1, C2 and C3. - Select the Replication - the column identifying the replication; here
Replication, numbered 1 to 4. - Select Variables - one or more response columns to analyse. You may select several at once, here
y1, y2, y3, y4, and RAISINS analyses each in turn. - Click for Transformation - an optional toggle to transform a skewed response before analysis (see below).
The first two selectors deserve a moment’s care, although for a different reason than in a split-plot. Because the strip-plot treats its two factors symmetrically, swapping them does not invalidate the model; it relabels it. Factor A is always tested against Error(A) and factor B against Error(B), so if you enter the two columns the wrong way round, every number in the output is still correctly computed, but the row heading now describes the wrong physical strip. Enter them in the direction the treatments were actually applied in the field, as explained in above, and the tables will describe your experiment rather than its mirror image.
When the columns are chosen, click Run Analysis!. RAISINS fits the strip-plot model to every selected response and fills the results sub-tabs, Analysis Results, Basic Plots, Advanced Plots, Interpretation, Multivariate, FAQs and View Data.
You do not need to run the module once per response. Select all the response columns together and RAISINS produces a complete ANOVA, mean-comparison and effect-size table for each. This is why every results table in the next section carries one column per trait, y1 through y4.
7.1 Optional: transforming a response
The strip-plot ANOVA assumes that each response is roughly normal and that its variability is similar across treatments. When a trait is strongly skewed, or its spread grows as its mean grows, tick Click for Transformation before running the analysis and choose a transformation from the options that appear: a logarithmic, a square-root or an arcsine transformation, the last for data recorded as proportions between 0 and 1. RAISINS applies the transformation to the selected response, runs the whole analysis on the transformed scale, and reports the transformed mean in parentheses beside each original mean so you can always trace what was done.
A transformation is a temporary change of scale to make the test valid; it does not change your experiment. Report that a transformation was used, but discuss the means and recommendations in the original units. If no assumption is violated, leave the toggle off, an unnecessary transformation only makes the results harder to read.
8 Analysis results
The Analysis Results tab presents the strip-plot ANOVA results. The analysis uses the selected significance level and multiple-comparison method. The results are presented for the row factor, column factor, and their interaction.
Table 1: ANOVA summary
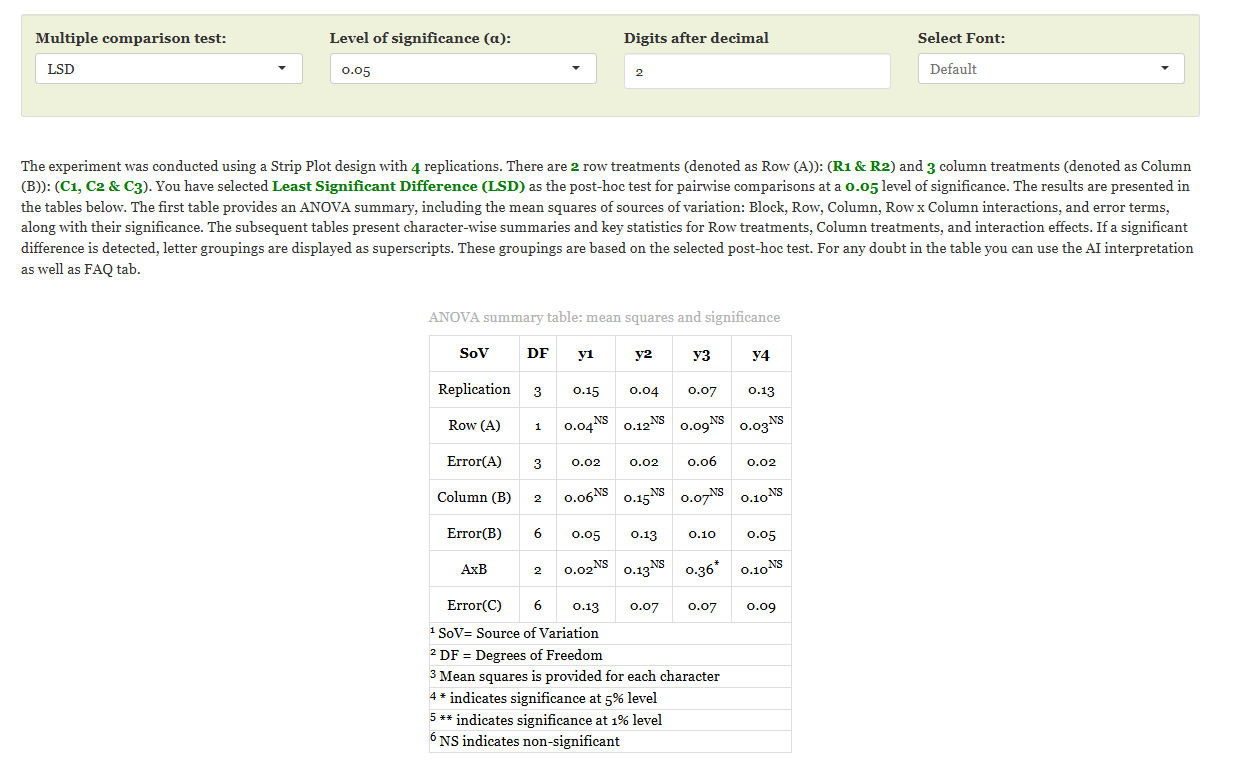
The ANOVA table shows whether the row factor, column factor, and their interaction are statistically significant. Each effect is tested against its appropriate error term.
For the present example, the A × B interaction is significant for y3, while the other effects are not significant.
Table 2: Row treatments (A)
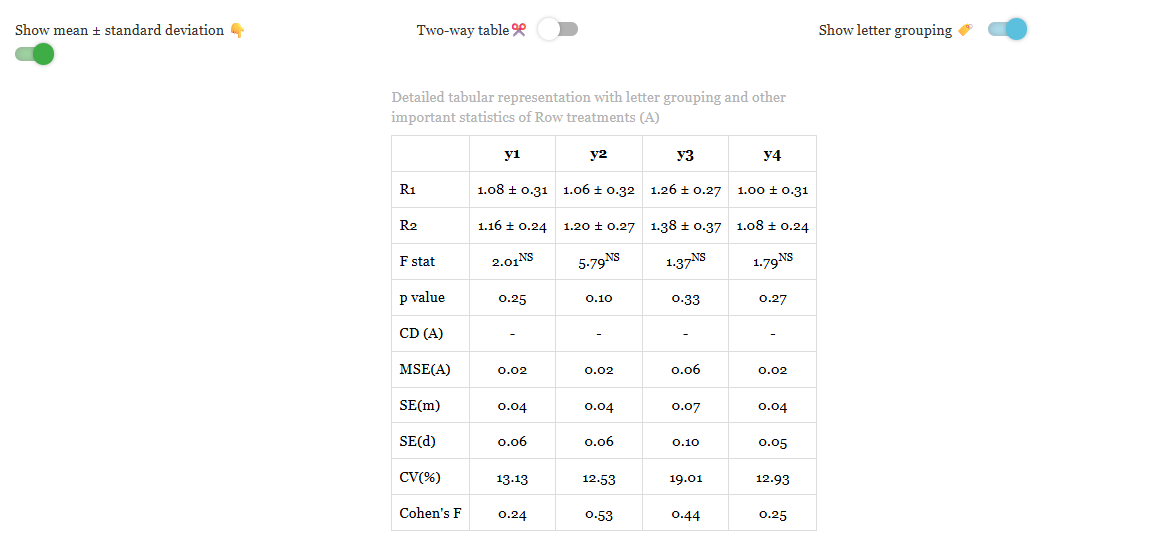
The row-treatment table gives the mean response for R1 and R2. R2 has a higher mean than R1 for all four responses considered in the example. However, these differences are not statistically significant at the 5% level.
Thus, the analysis does not provide sufficient evidence of a row-treatment effect.
Table 3: Column treatments (B)
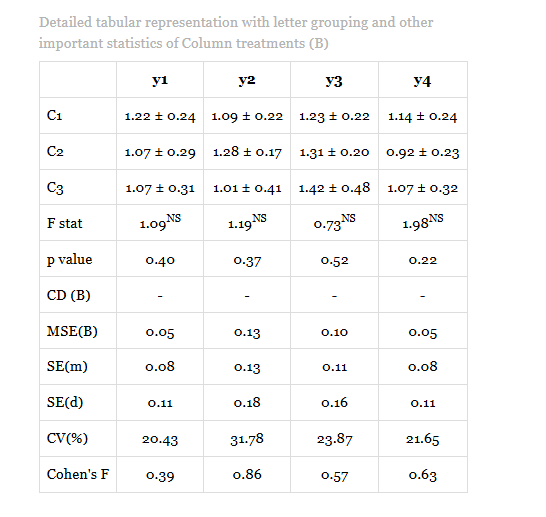
The column-treatment table compares the three column treatments. Although the treatment means differ across the responses, none of the column-treatment effects is statistically significant at the 5% level.
Thus, the analysis does not provide sufficient evidence of a column-treatment effect.
Table 4: Interaction A x B
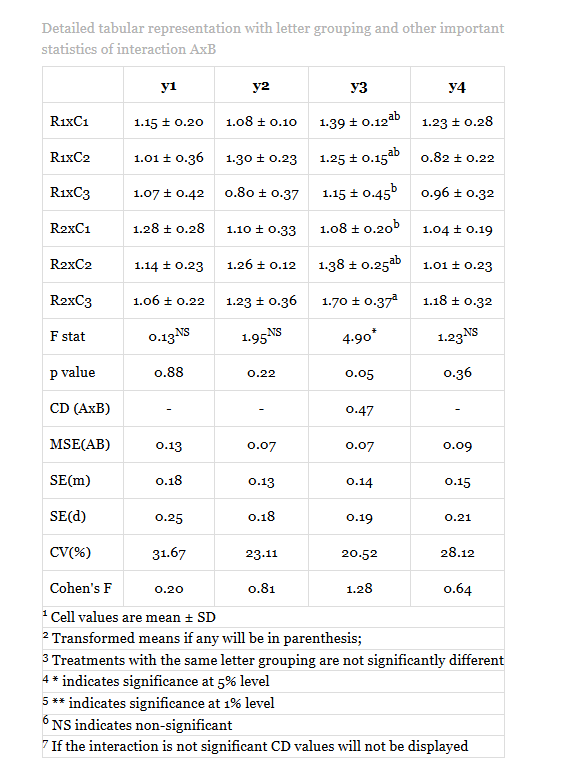
The interaction table gives the means for the six row × column treatment combinations. It is used to examine the treatment combinations when the interaction is significant.
For y3, the A × B interaction is significant (\(F=4.90^{*}\), \(p=0.05\)). The highest mean is observed for R2 × C3 (\(1.70 \pm 0.37\)). The letter groupings indicate the treatment combinations that differ significantly.
For y1, y2, and y4, the interaction is not significant. Therefore, no significant interaction between the two factors is established for these responses.
8.1 Which critical difference to use
Each table carries its own critical difference, because each effect is tested against a different error. The appropriate one must be selected according to the comparison being made.
| To compare | Use | Reported in |
|---|---|---|
| two row treatments (R1 against R2) | CD (A) | Figure 10 |
| two column treatments (C1, C2, C3) | CD (B) | Figure 11 |
| two combinations (for example R2xC3 against R2xC1) | CD (AxB) | Figure 12 |
A critical difference from one table must never be used to judge a comparison belonging to another. In the present dataset only one of the three exists: CD (AxB) = 0.47 for y3.
8.2 The two-way table view
Three toggles above the tables control their display: Show mean ± standard deviation, Two-way table and Show letter grouping. Selecting Two-way table redraws the results as a grid, with row treatments down the side, column treatments across the top, and the averages in the margins (Figure 13).
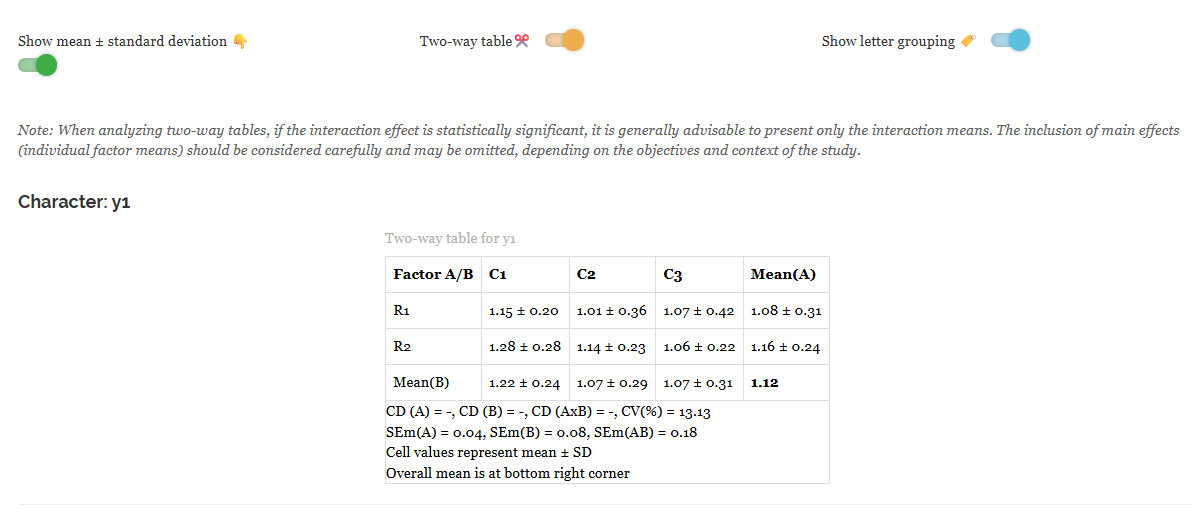
This is the most convenient form for reporting, since the cell means and the marginal averages appear together and the three critical differences are printed on a single line beneath. For y1 that line reads CD (A) = -, CD (B) = -, CD (AxB) = -, CV(%) = 13.13, with SEm(A) = 0.04, SEm(B) = 0.08, SEm(AB) = 0.18 and an overall mean of 1.12. The three dashes confirm that no effect was significant for y1.
The three standard errors increase from 0.04 to 0.08 to 0.18. A marginal mean is averaged over more observations than a single cell, and is therefore estimated more precisely. A note above the tables advises that, where the interaction is significant, the interaction means should be presented in preference to the main-effect averages. In this dataset that advice applies to y3 alone.
8.3 Summary of the results
The analysis yields one significant finding and three non-findings.
y3. The interaction is significant, which means that the effect of the column treatment depends on the row treatment with which it is crossed. Under R1 the mean falls from C1 to C3 (1.39, 1.25, 1.15); under R2 it rises across the same treatments (1.08, 1.38, 1.70). The recommendation for y3 is therefore R2 combined with C3, and no column treatment should be recommended without stating the row treatment accompanying it.
y1, y2 and y4. No effect reached significance, neither the row factor, nor the column factor, nor their interaction. Under this design and four replications, neither treatment altered these traits detectably.
A dash indicates that the experiment could not demonstrate a difference; it does not indicate that no difference exists. Error(A) carries only 3 degrees of freedom, and Error(B) and Error(C) 6 each, so the design has limited power to detect the main effects. Where a difference is of practical importance, the appropriate remedy is additional replication rather than a stronger claim from the present data.
9 Visualising the results
RAISINS provides Basic Plots and Advanced Plots for visualising the results. Each plot can be selected, customised, and exported from the corresponding settings panel.
The Basic Plots tab (Figure 14) includes Boxplot, Violin Plot, Mean Value Plot, Connected Line Plot, and Bar Plot. Select Factor determines the factor shown on the x-axis, and Select Y-variables to plot determines the response variable.

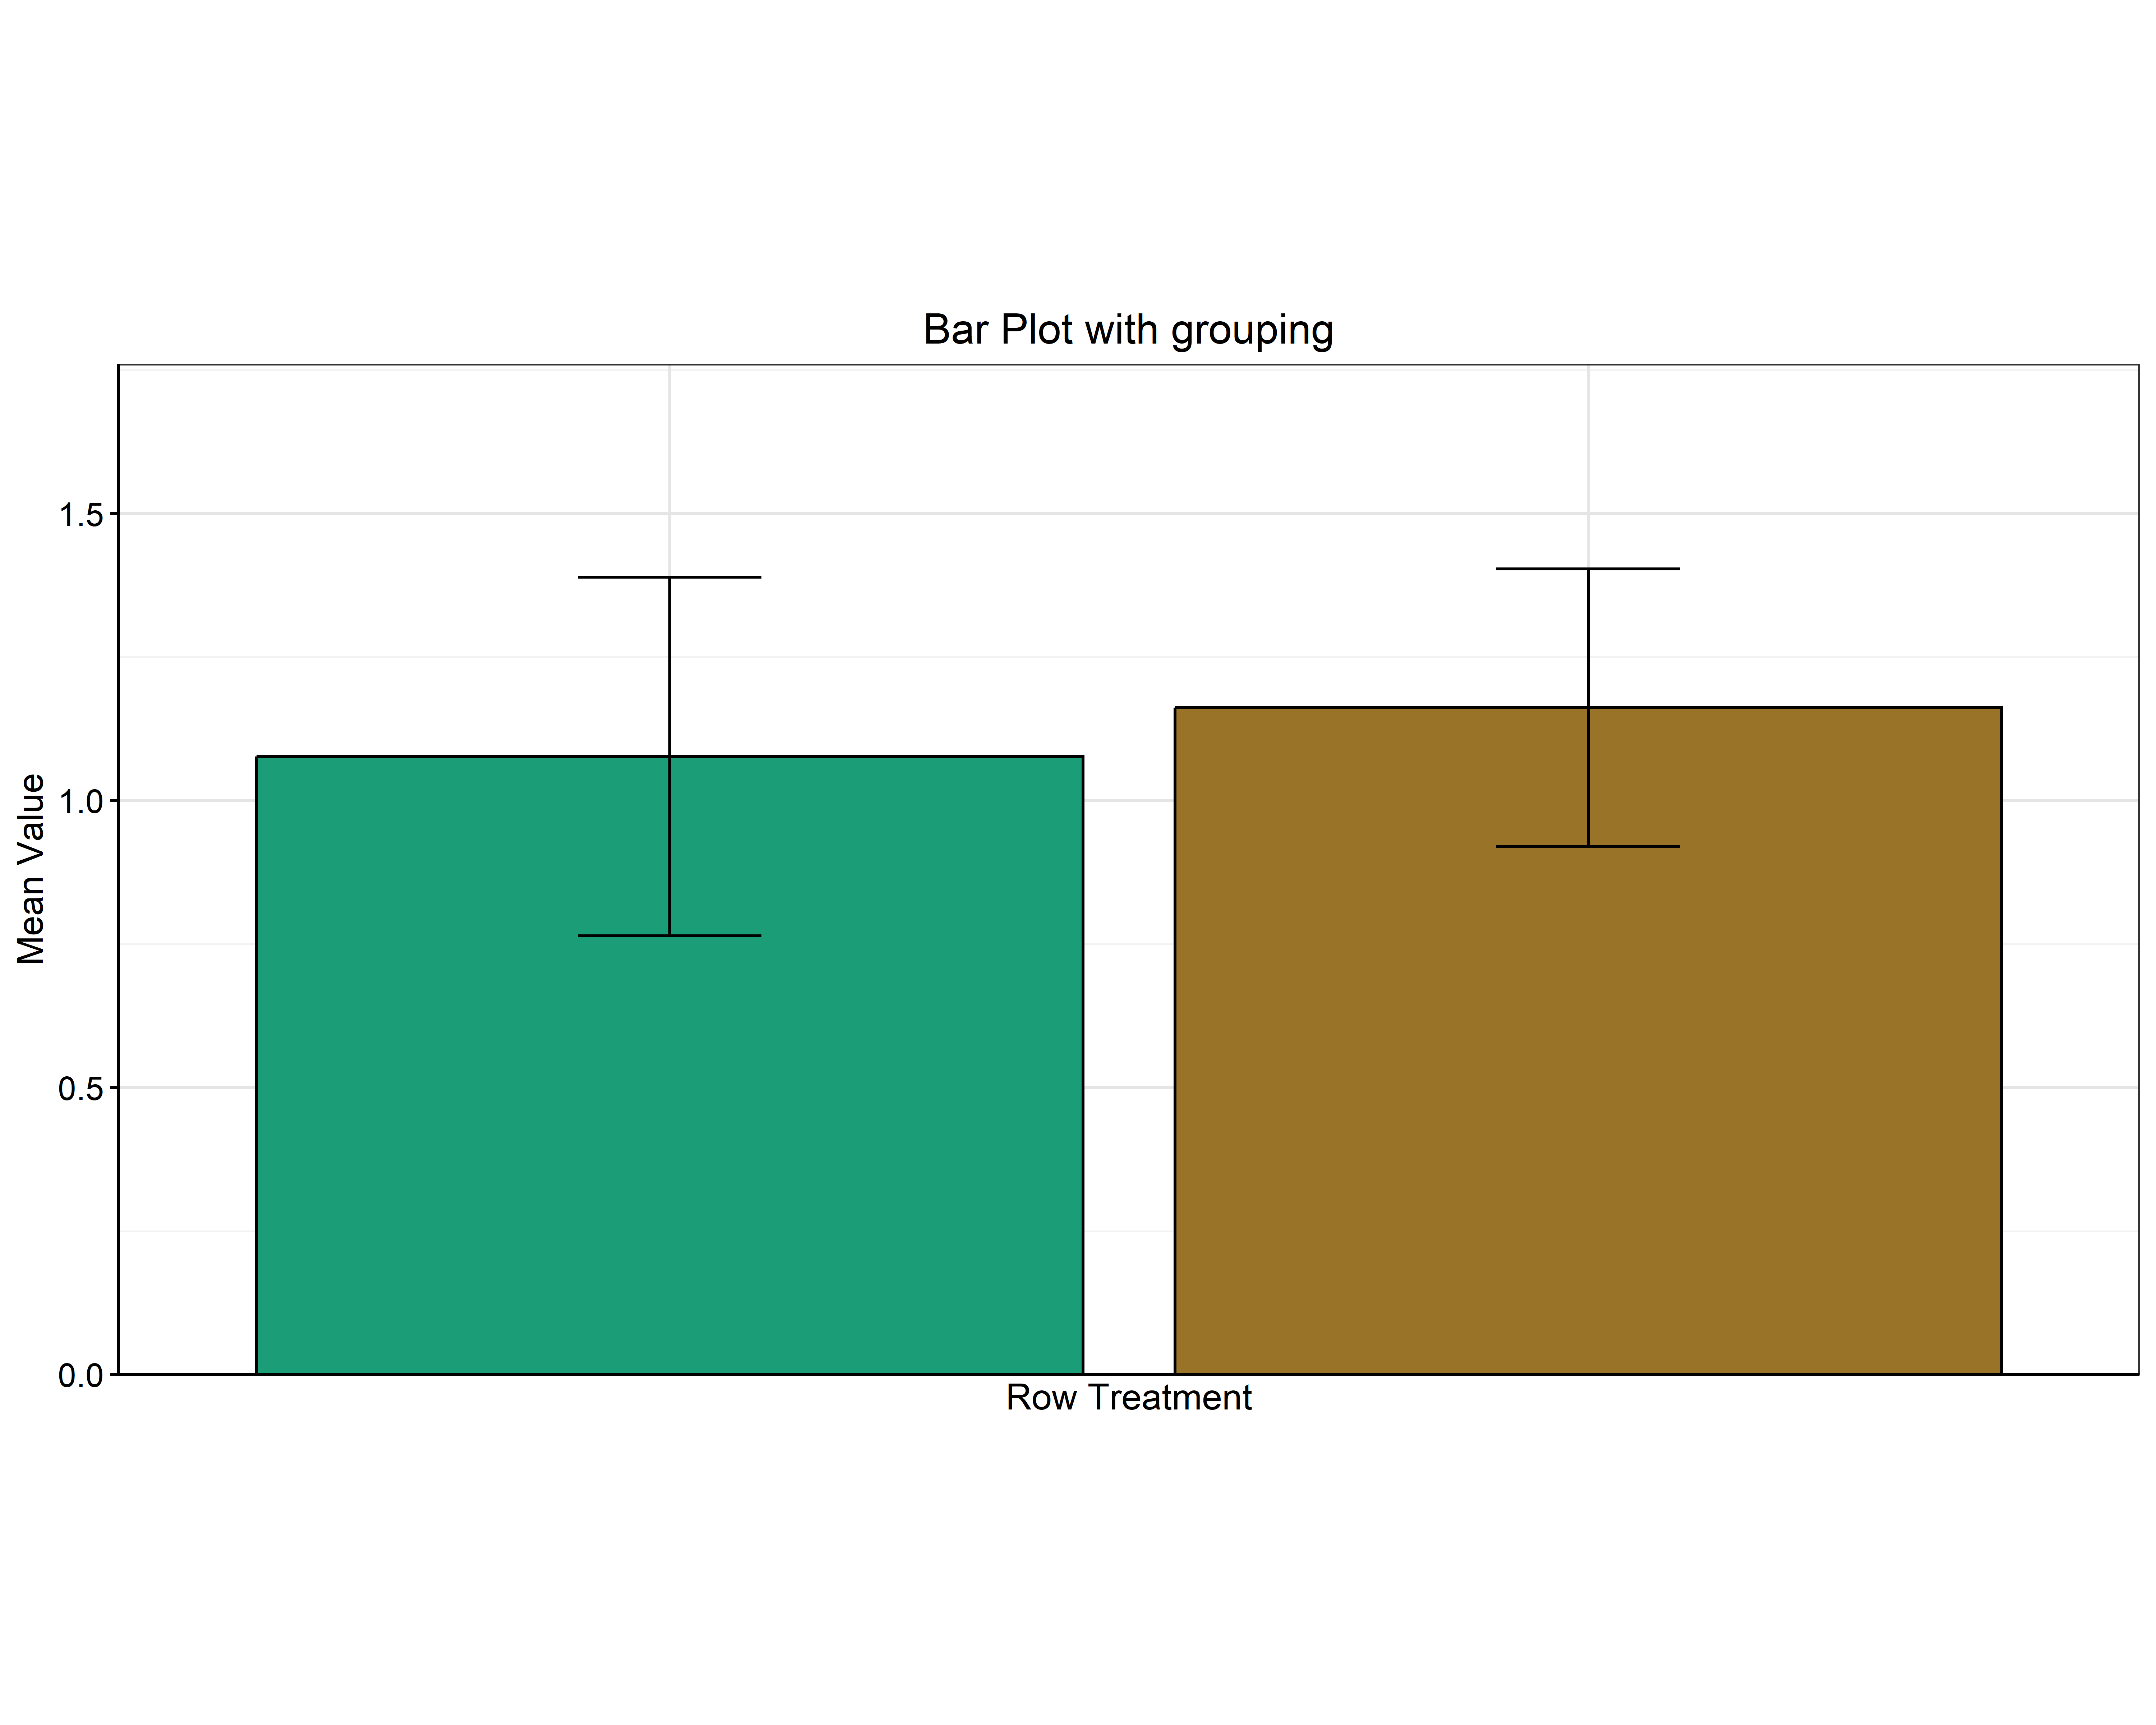
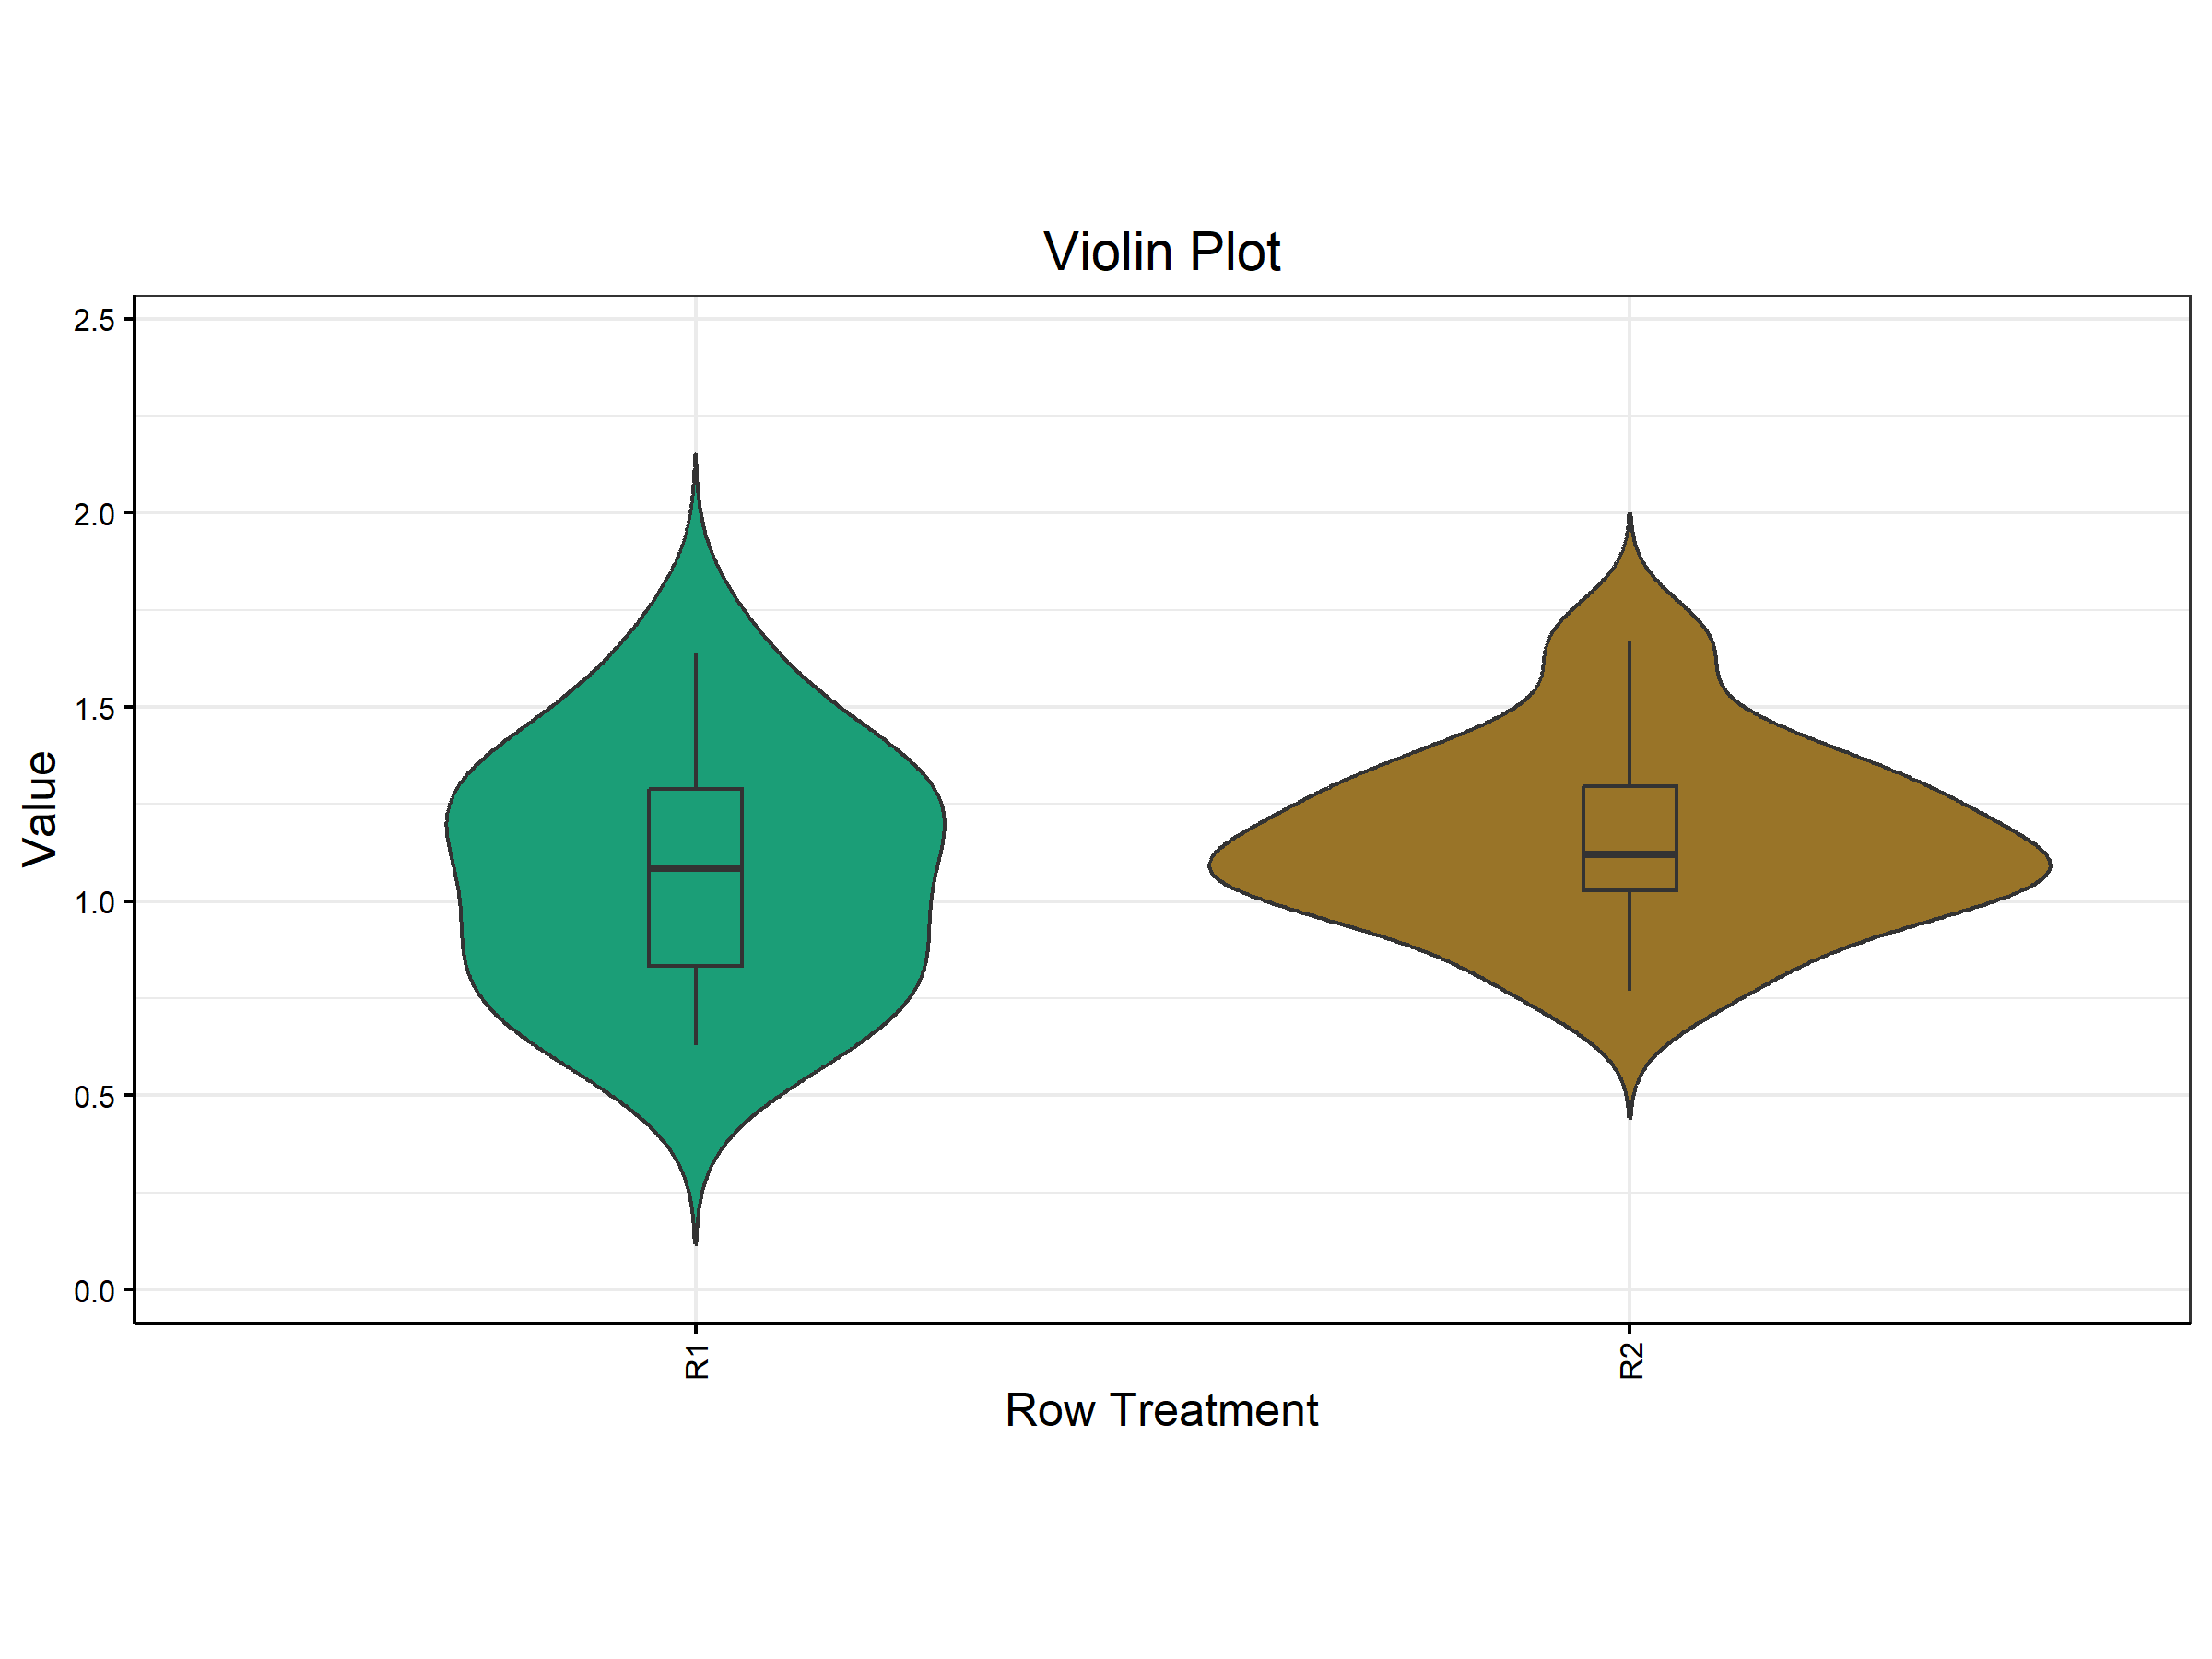
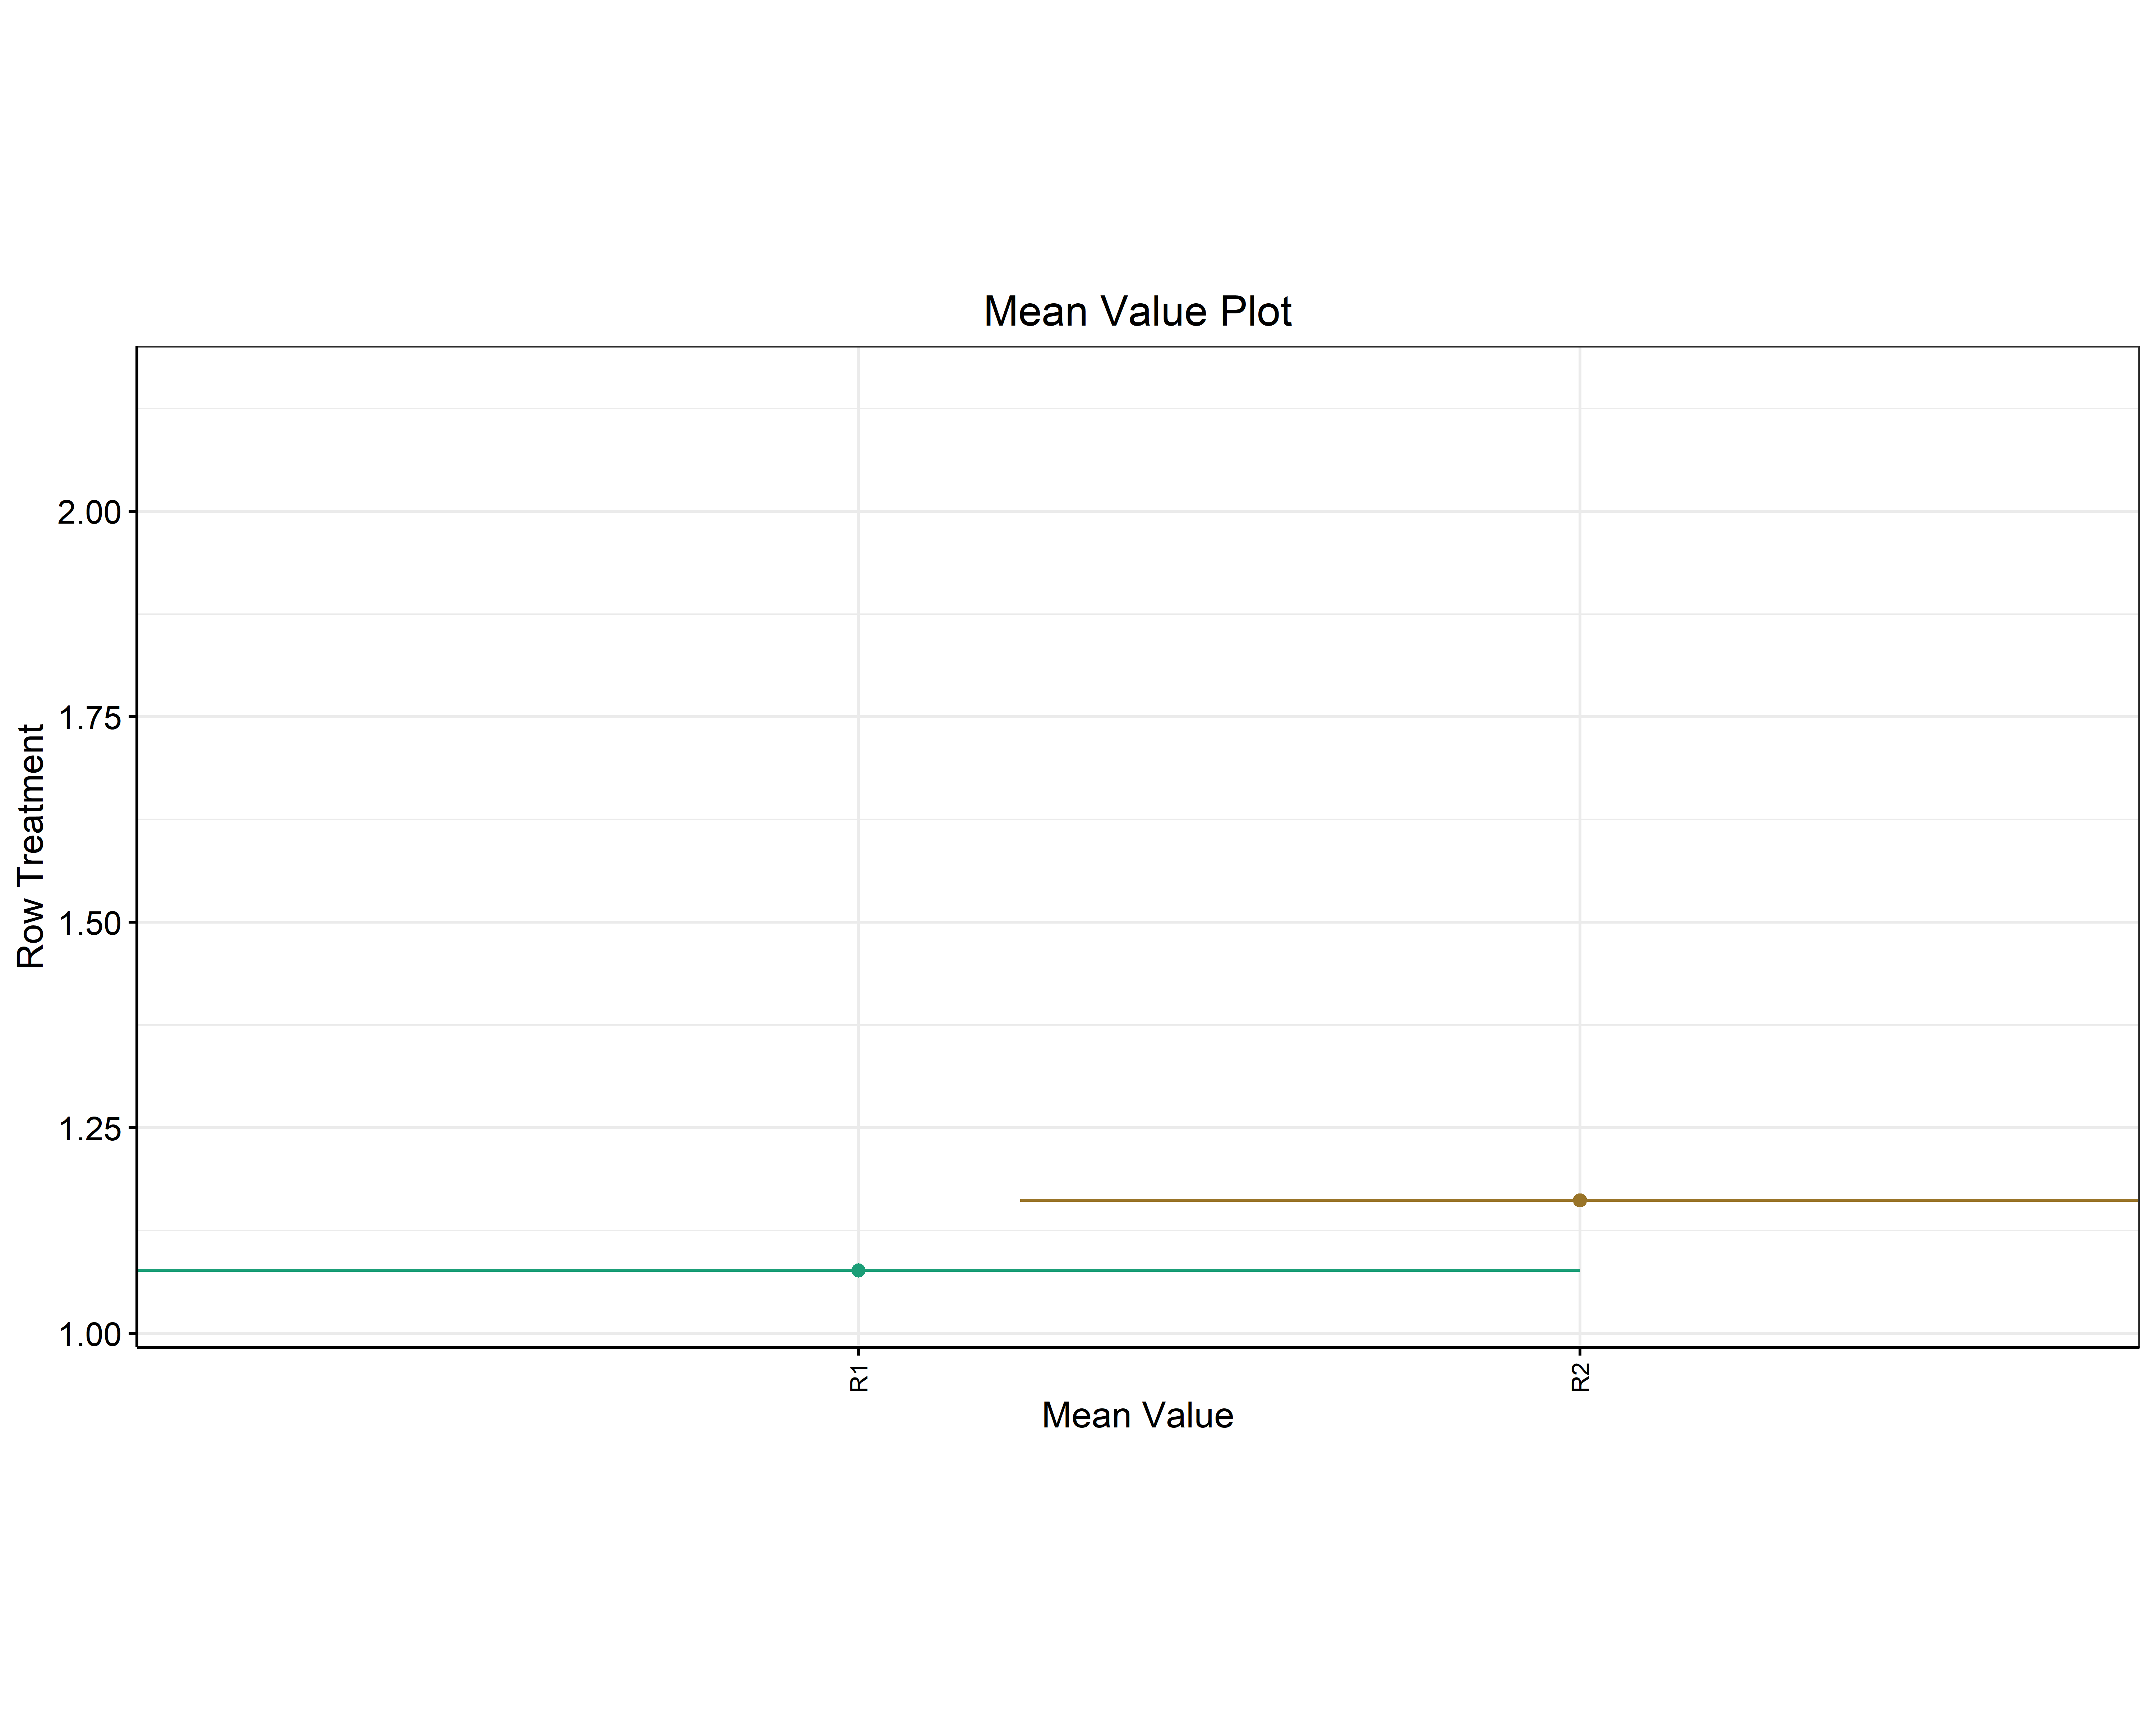
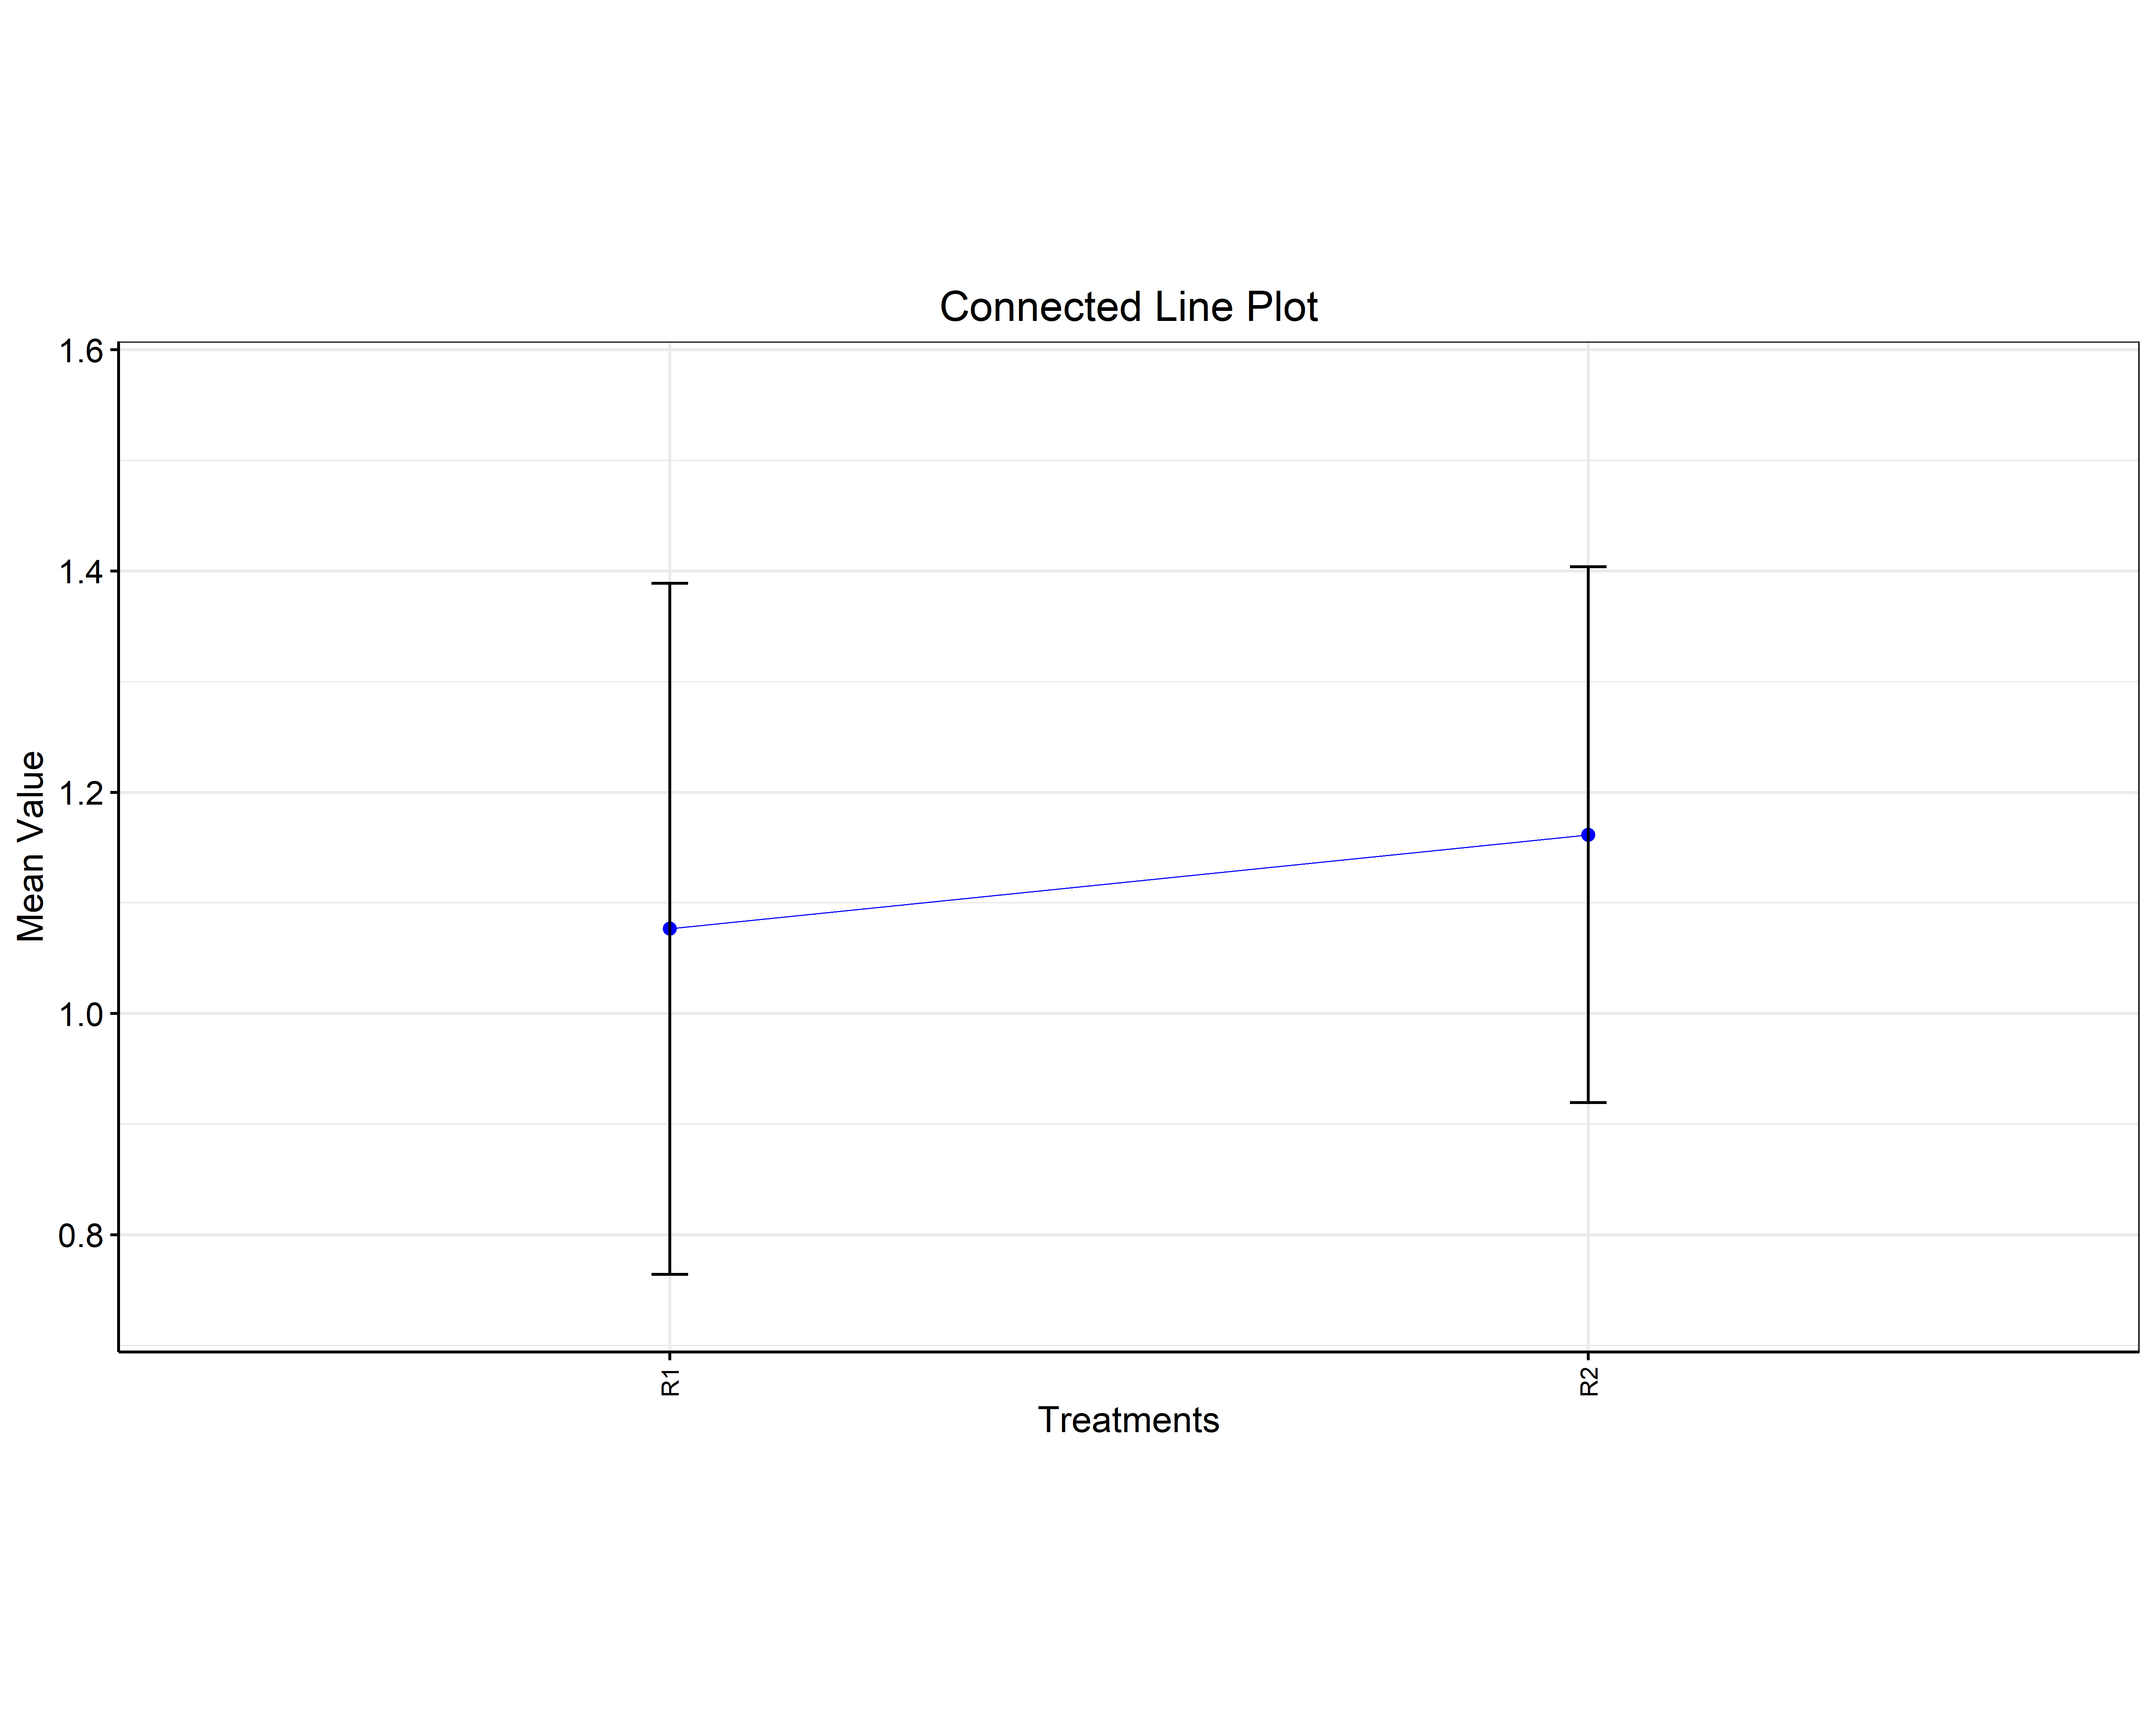
Any letters printed above a bar, box or point are the very letter groupings from the results tables, computed from the same critical difference and therefore from the same error stratum. A plot and its table can never disagree, they are two views of one computation, so use whichever communicates best to your audience.
The Advanced Plots tab (Figure 16) adds thirteen specialised graphics, arranged as a grid of icons: Interaction Plot I, II and III, a Summary Plot, a Raincloud Plot and an Advanced Raincloud Plot, a Circular Plot, a QQ Plot, a Distribution Plot, a Pair Plot, a Correlation Plot, a 3D Scatter Plot and a 3D Scatter + Line. Click any icon to draw its plot, then fine-tune it in the settings panel beneath.

The interaction plots
An interaction plot shows the mean response across the levels of the two factors. Approximately parallel lines suggest little or no interaction, whereas crossing or clearly diverging lines suggest an interaction. RAISINS provides three versions of the plot.
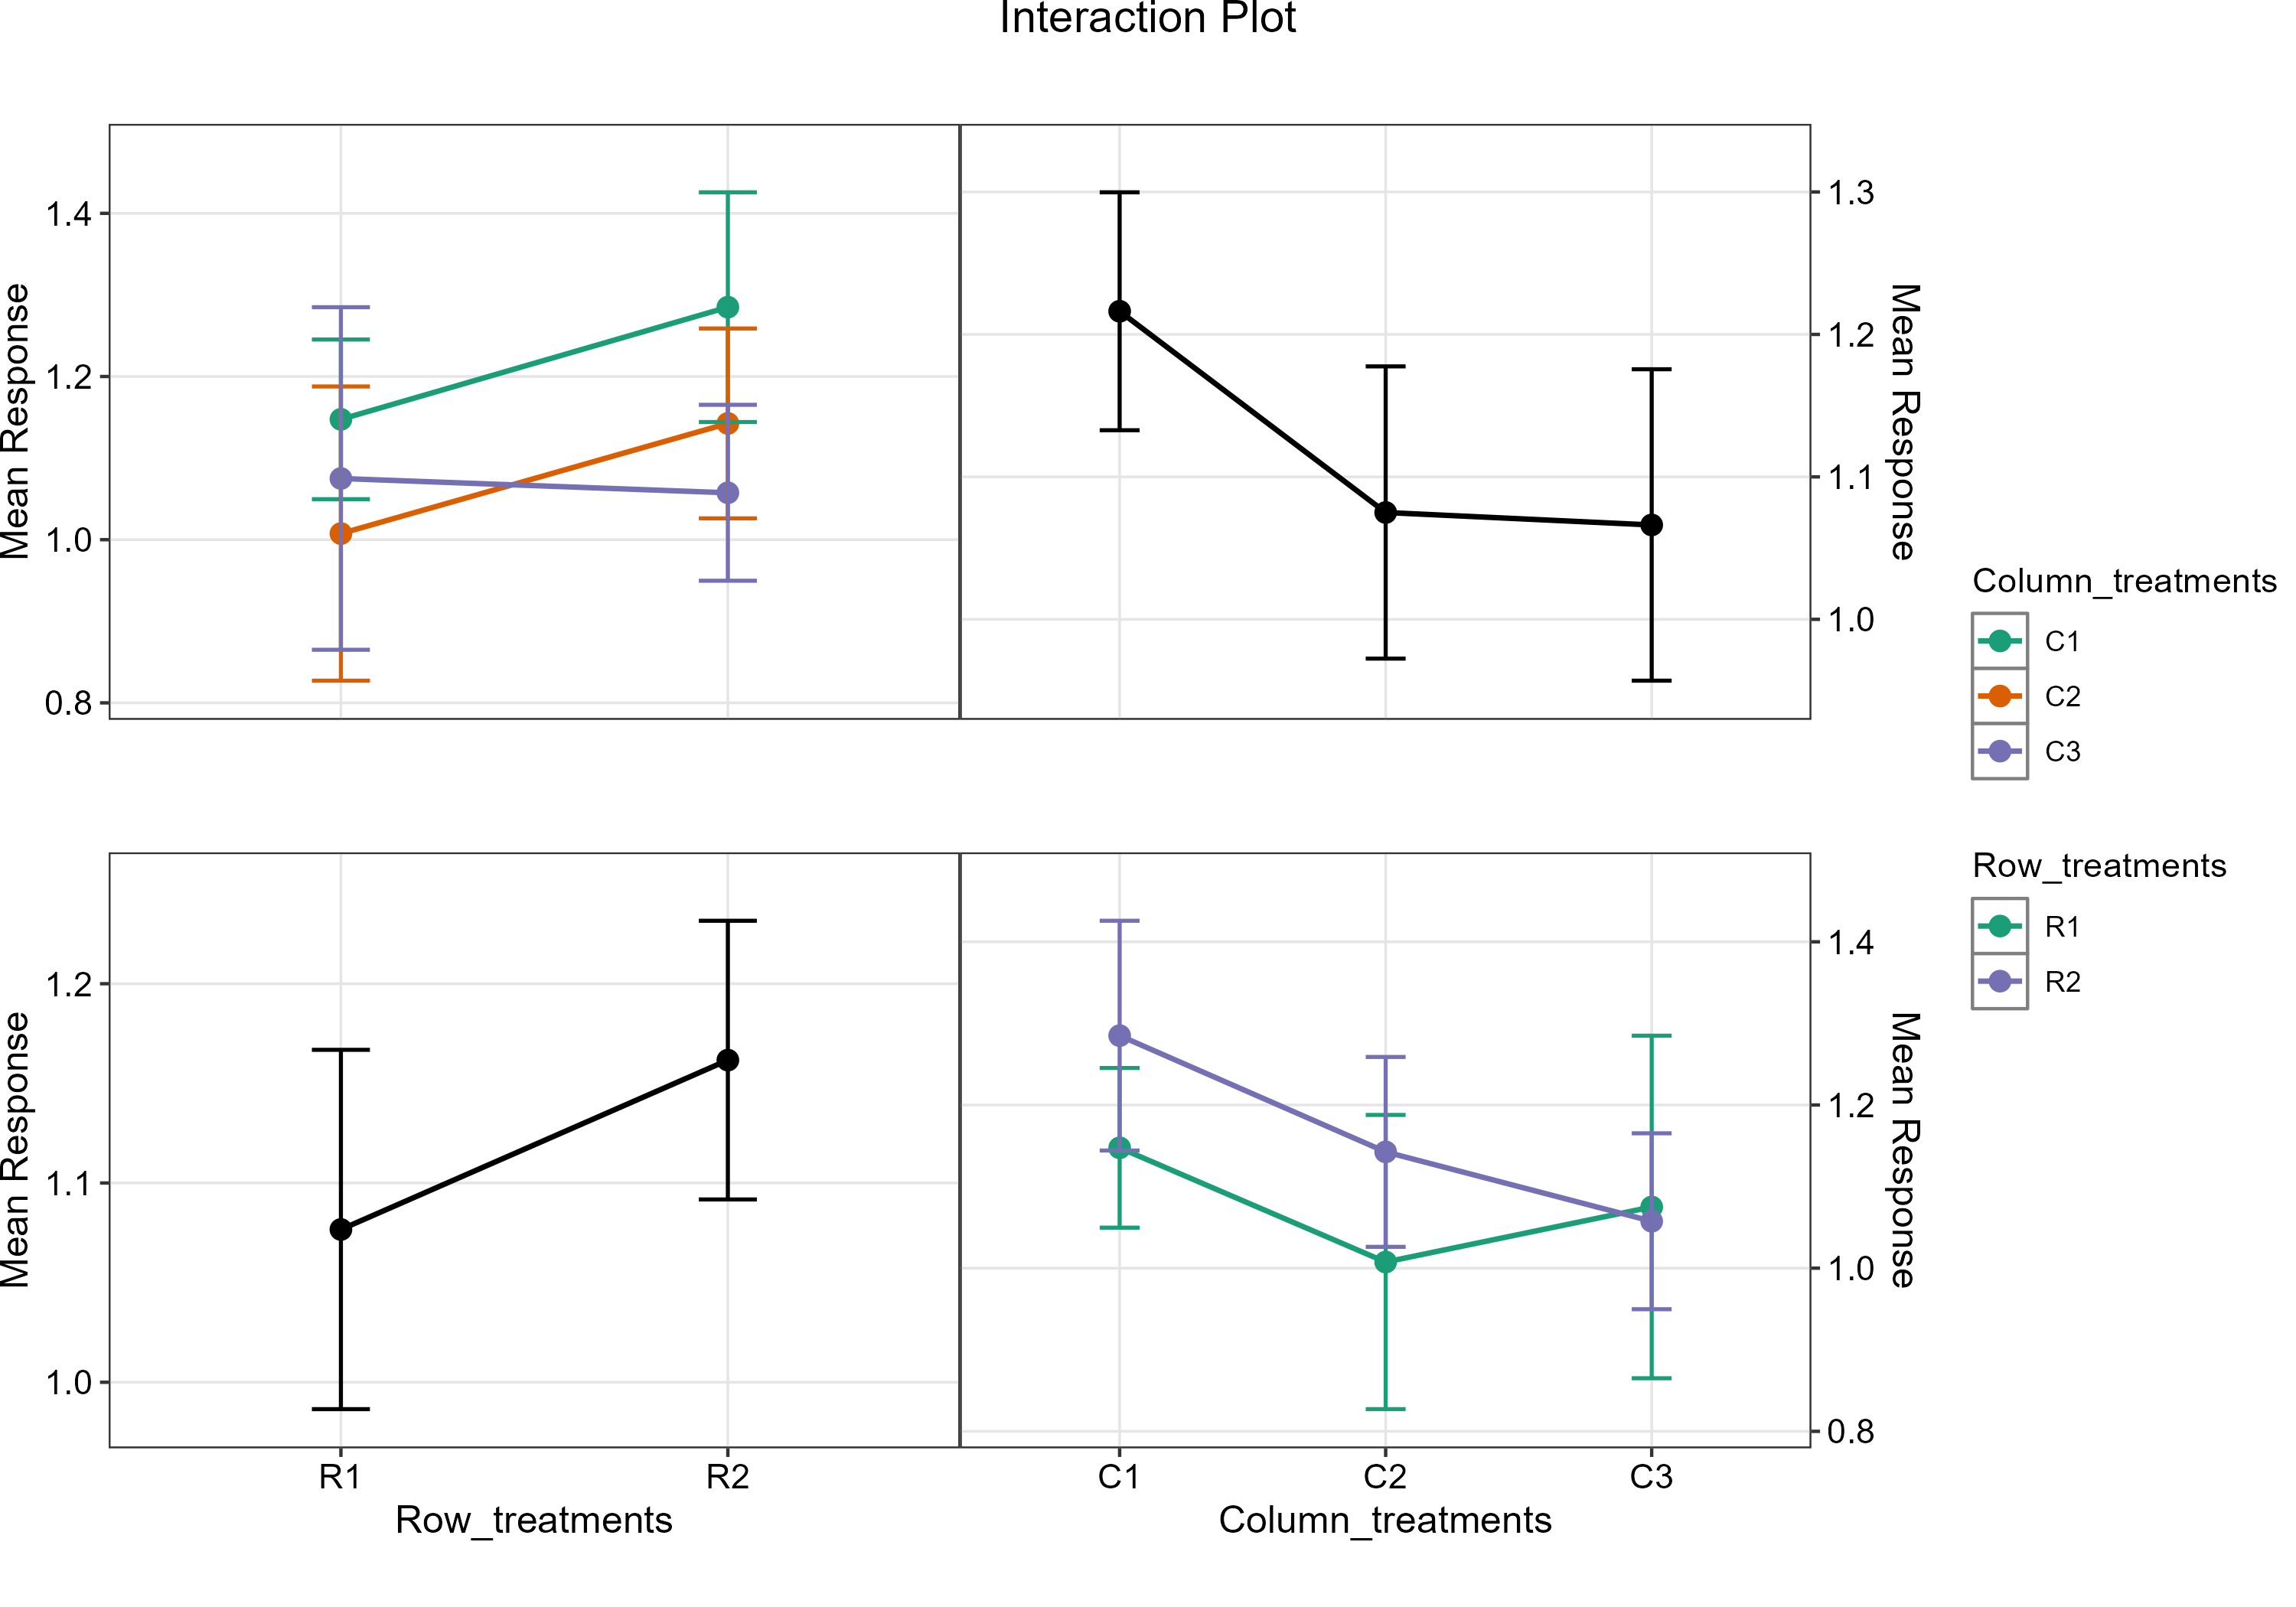
Figure 17 is drawn for y1, a trait whose interaction was not significant, and it shows what the absence of an interaction looks like. In the upper-left panel the three column profiles rise from R1 to R2 at much the same rate, so the lines are close to parallel and their error bars overlap throughout. The two black panels present the main effects alone: the row means rise slightly from 1.08 to 1.16, and the column means fall from 1.22 to about 1.07. Neither is significant.
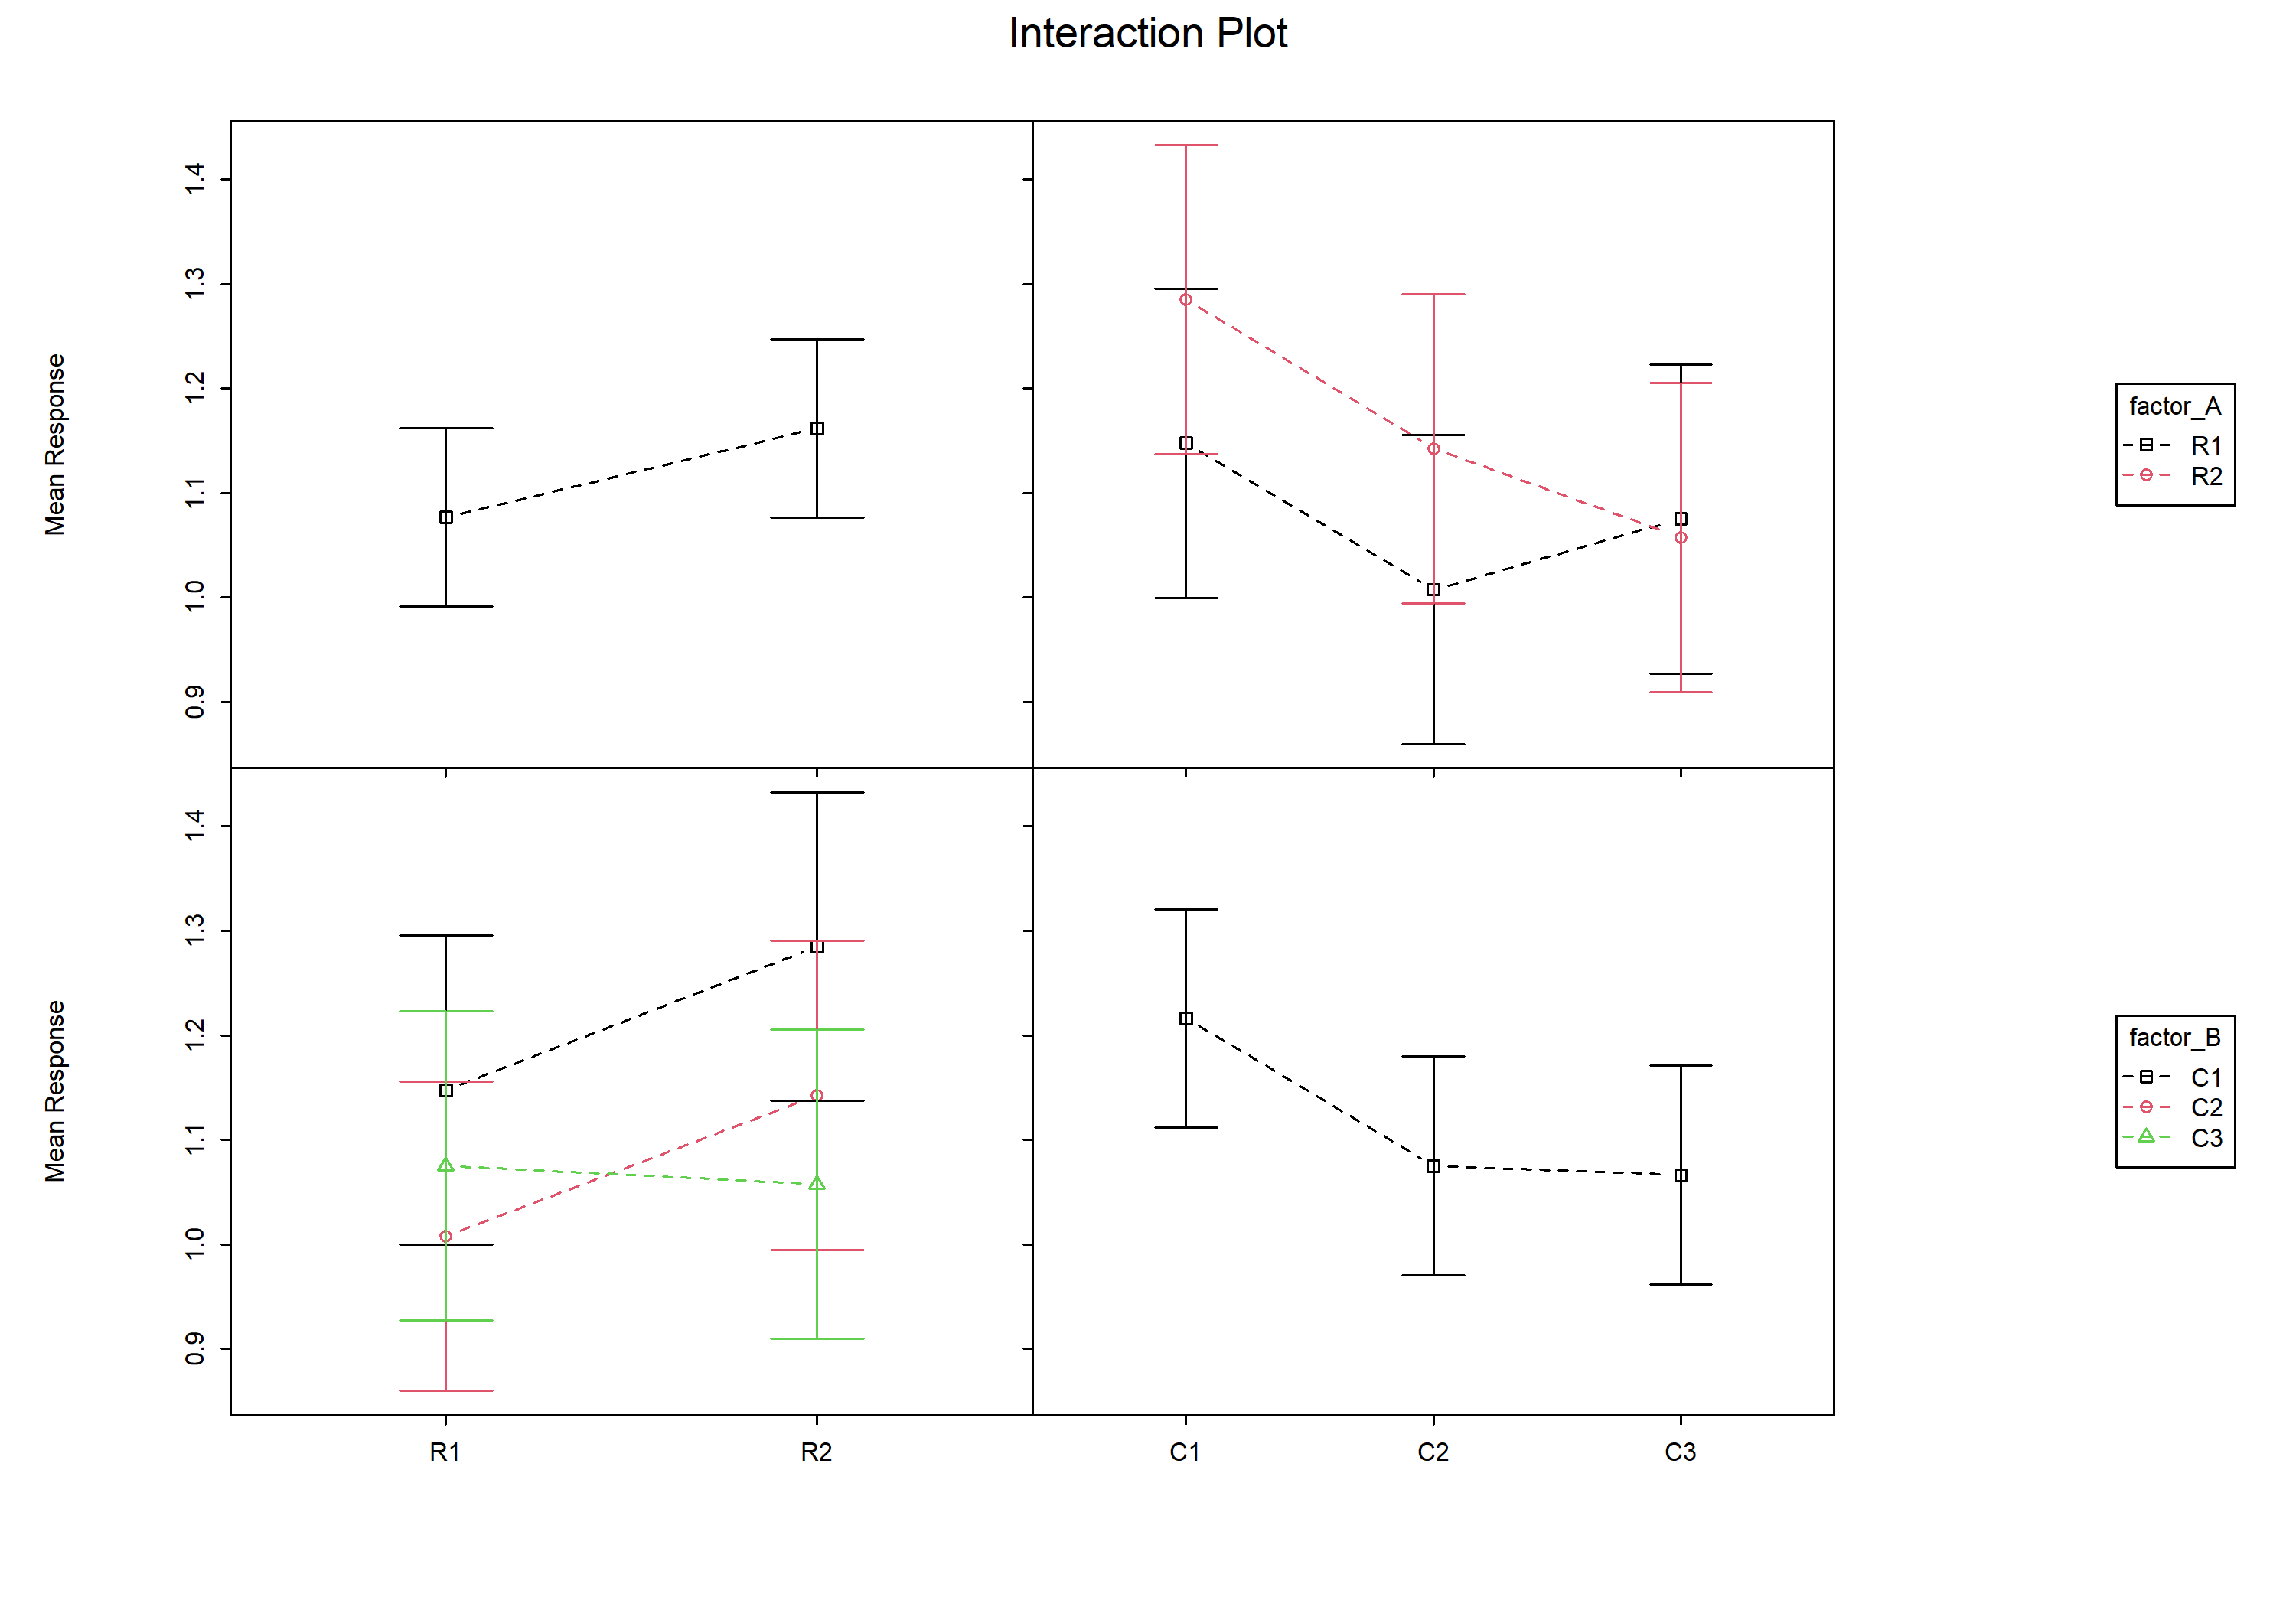
Figure 18 presents the same information on one pair of axes rather than four panels. It is usually the more suitable version for a manuscript figure, since both factors appear in a single frame.
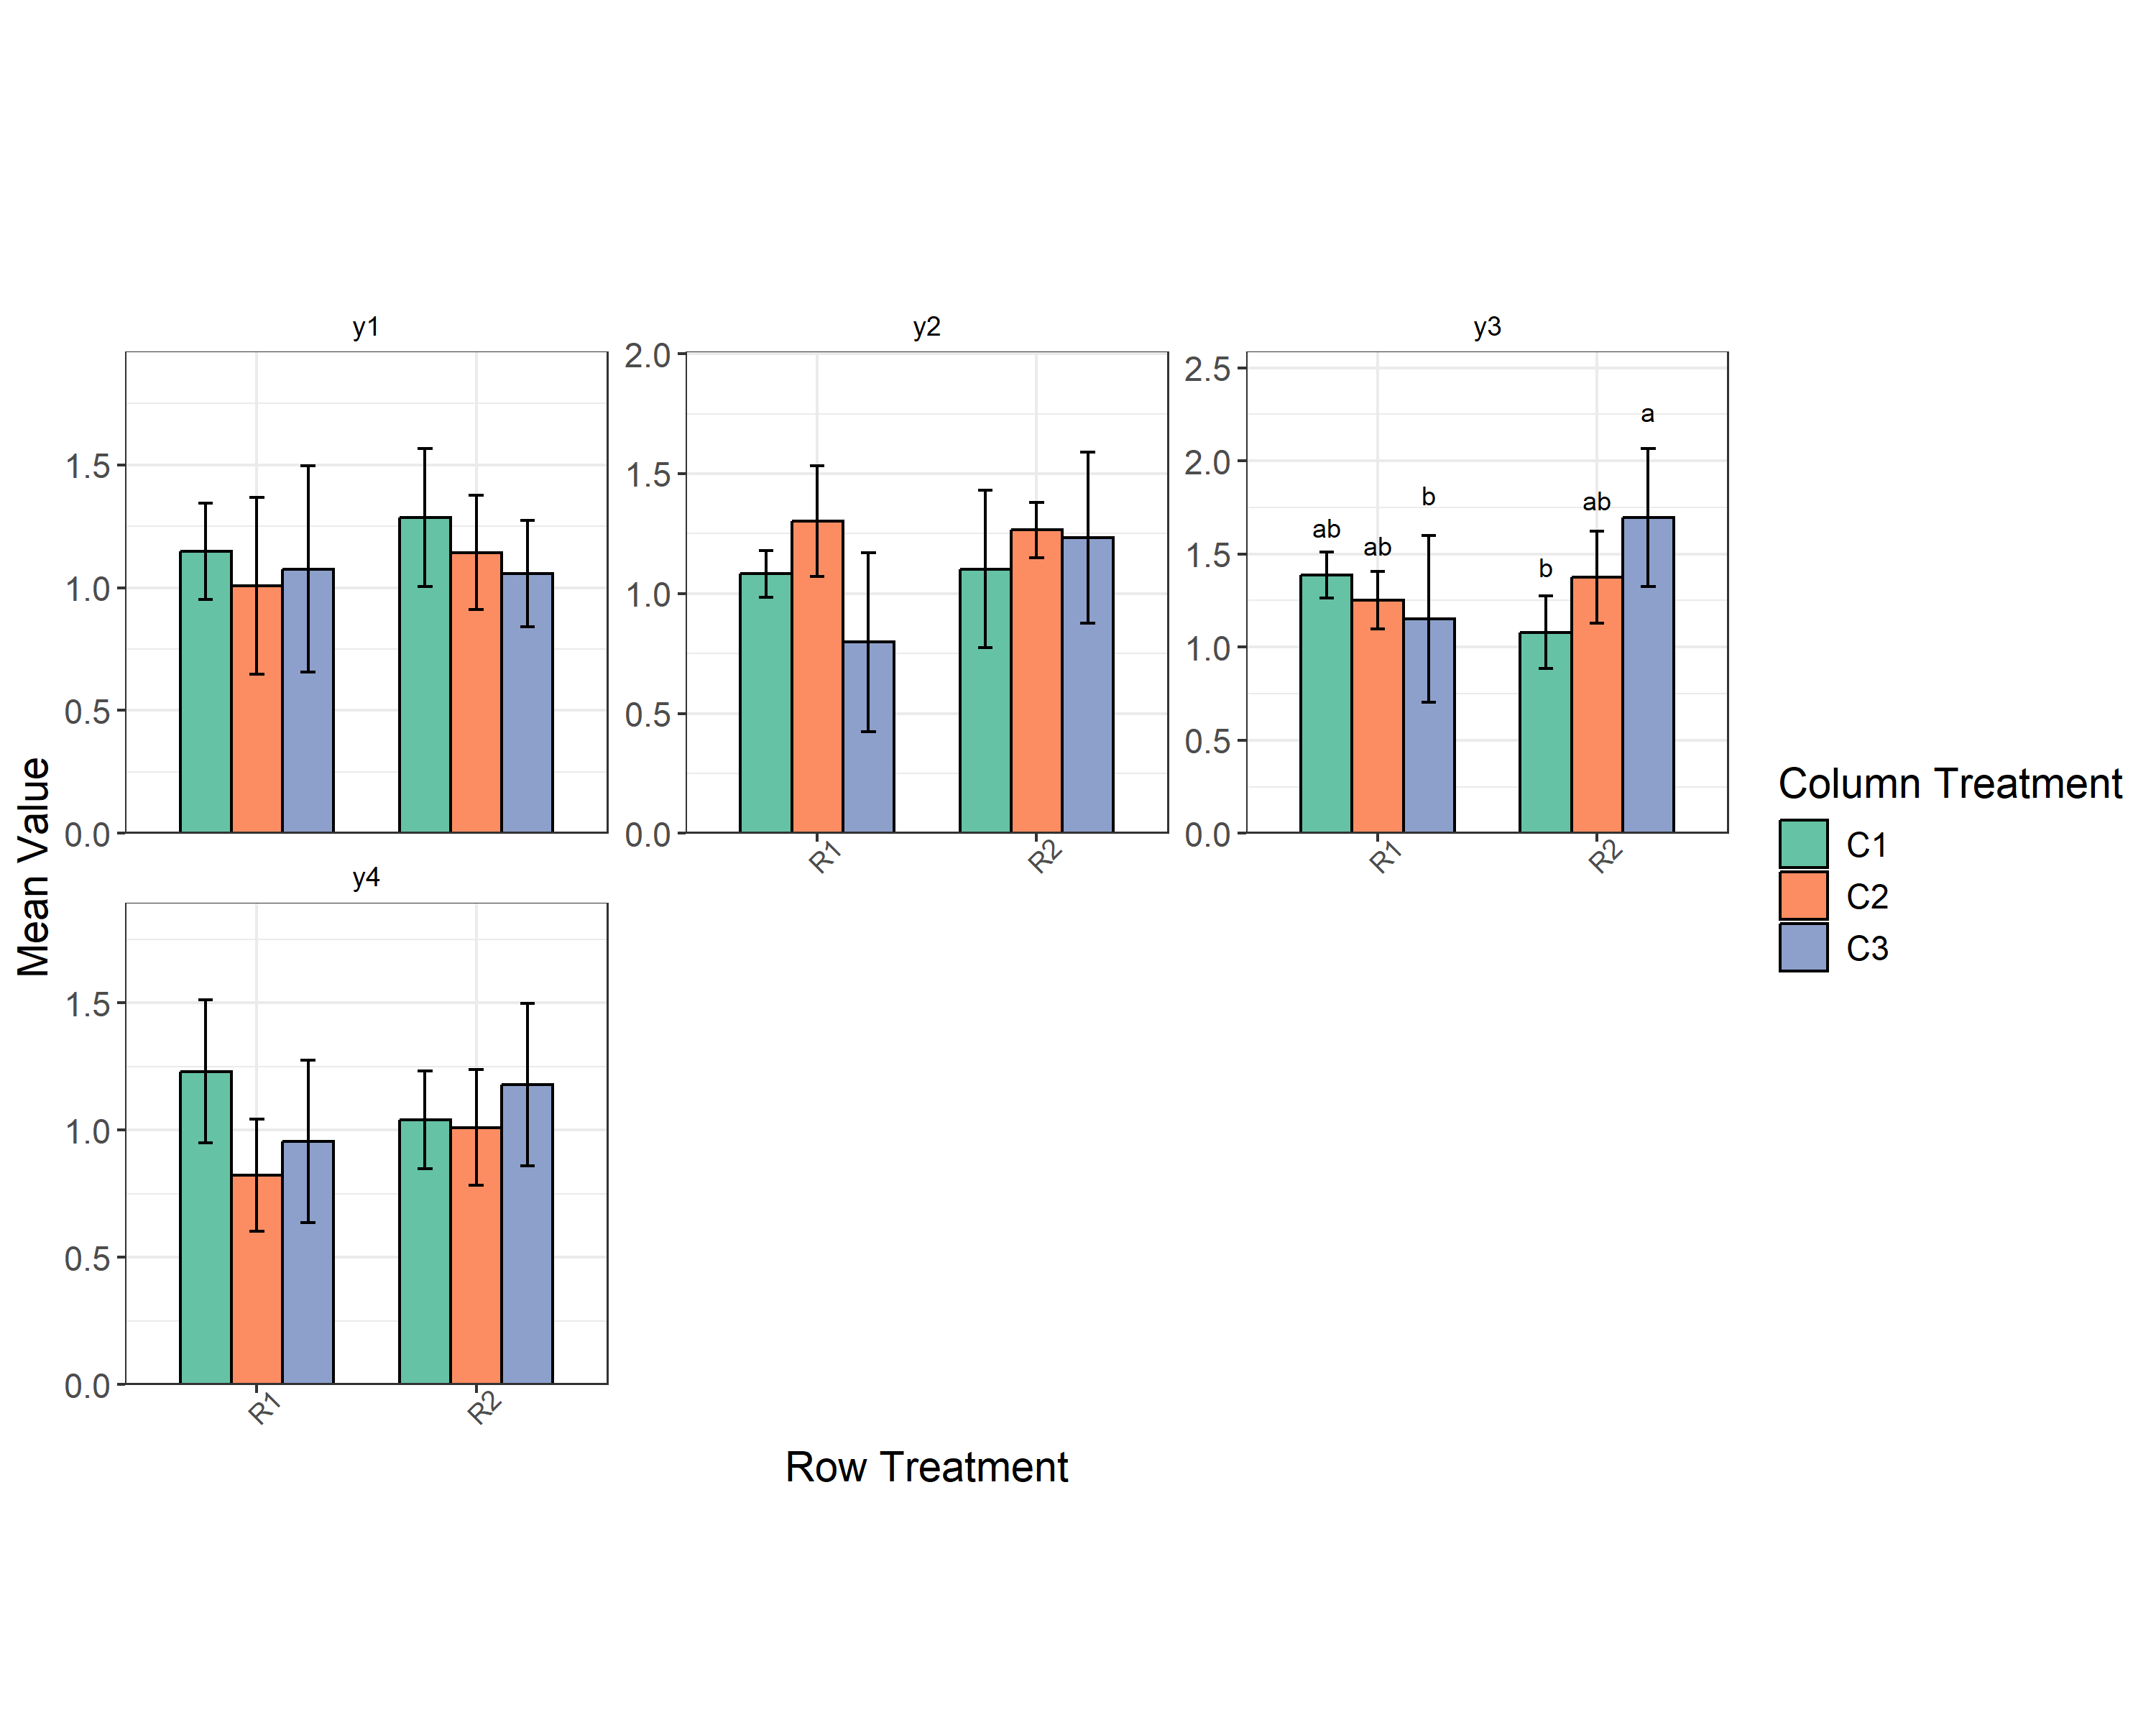
Figure 19 draws all four traits together and confirms the conclusion of Section 8. In the y1, y2 and y4 panels the bars are of similar height with widely overlapping error bars, which is the appearance of a non-significant result. The y3 panel differs. It is the only panel carrying letters: the bars under R1 decline from C1 to C3, while those under R2 rise to the highest mean, R2xC3, marked a. This opposition of trends is the significant interaction in graphical form.
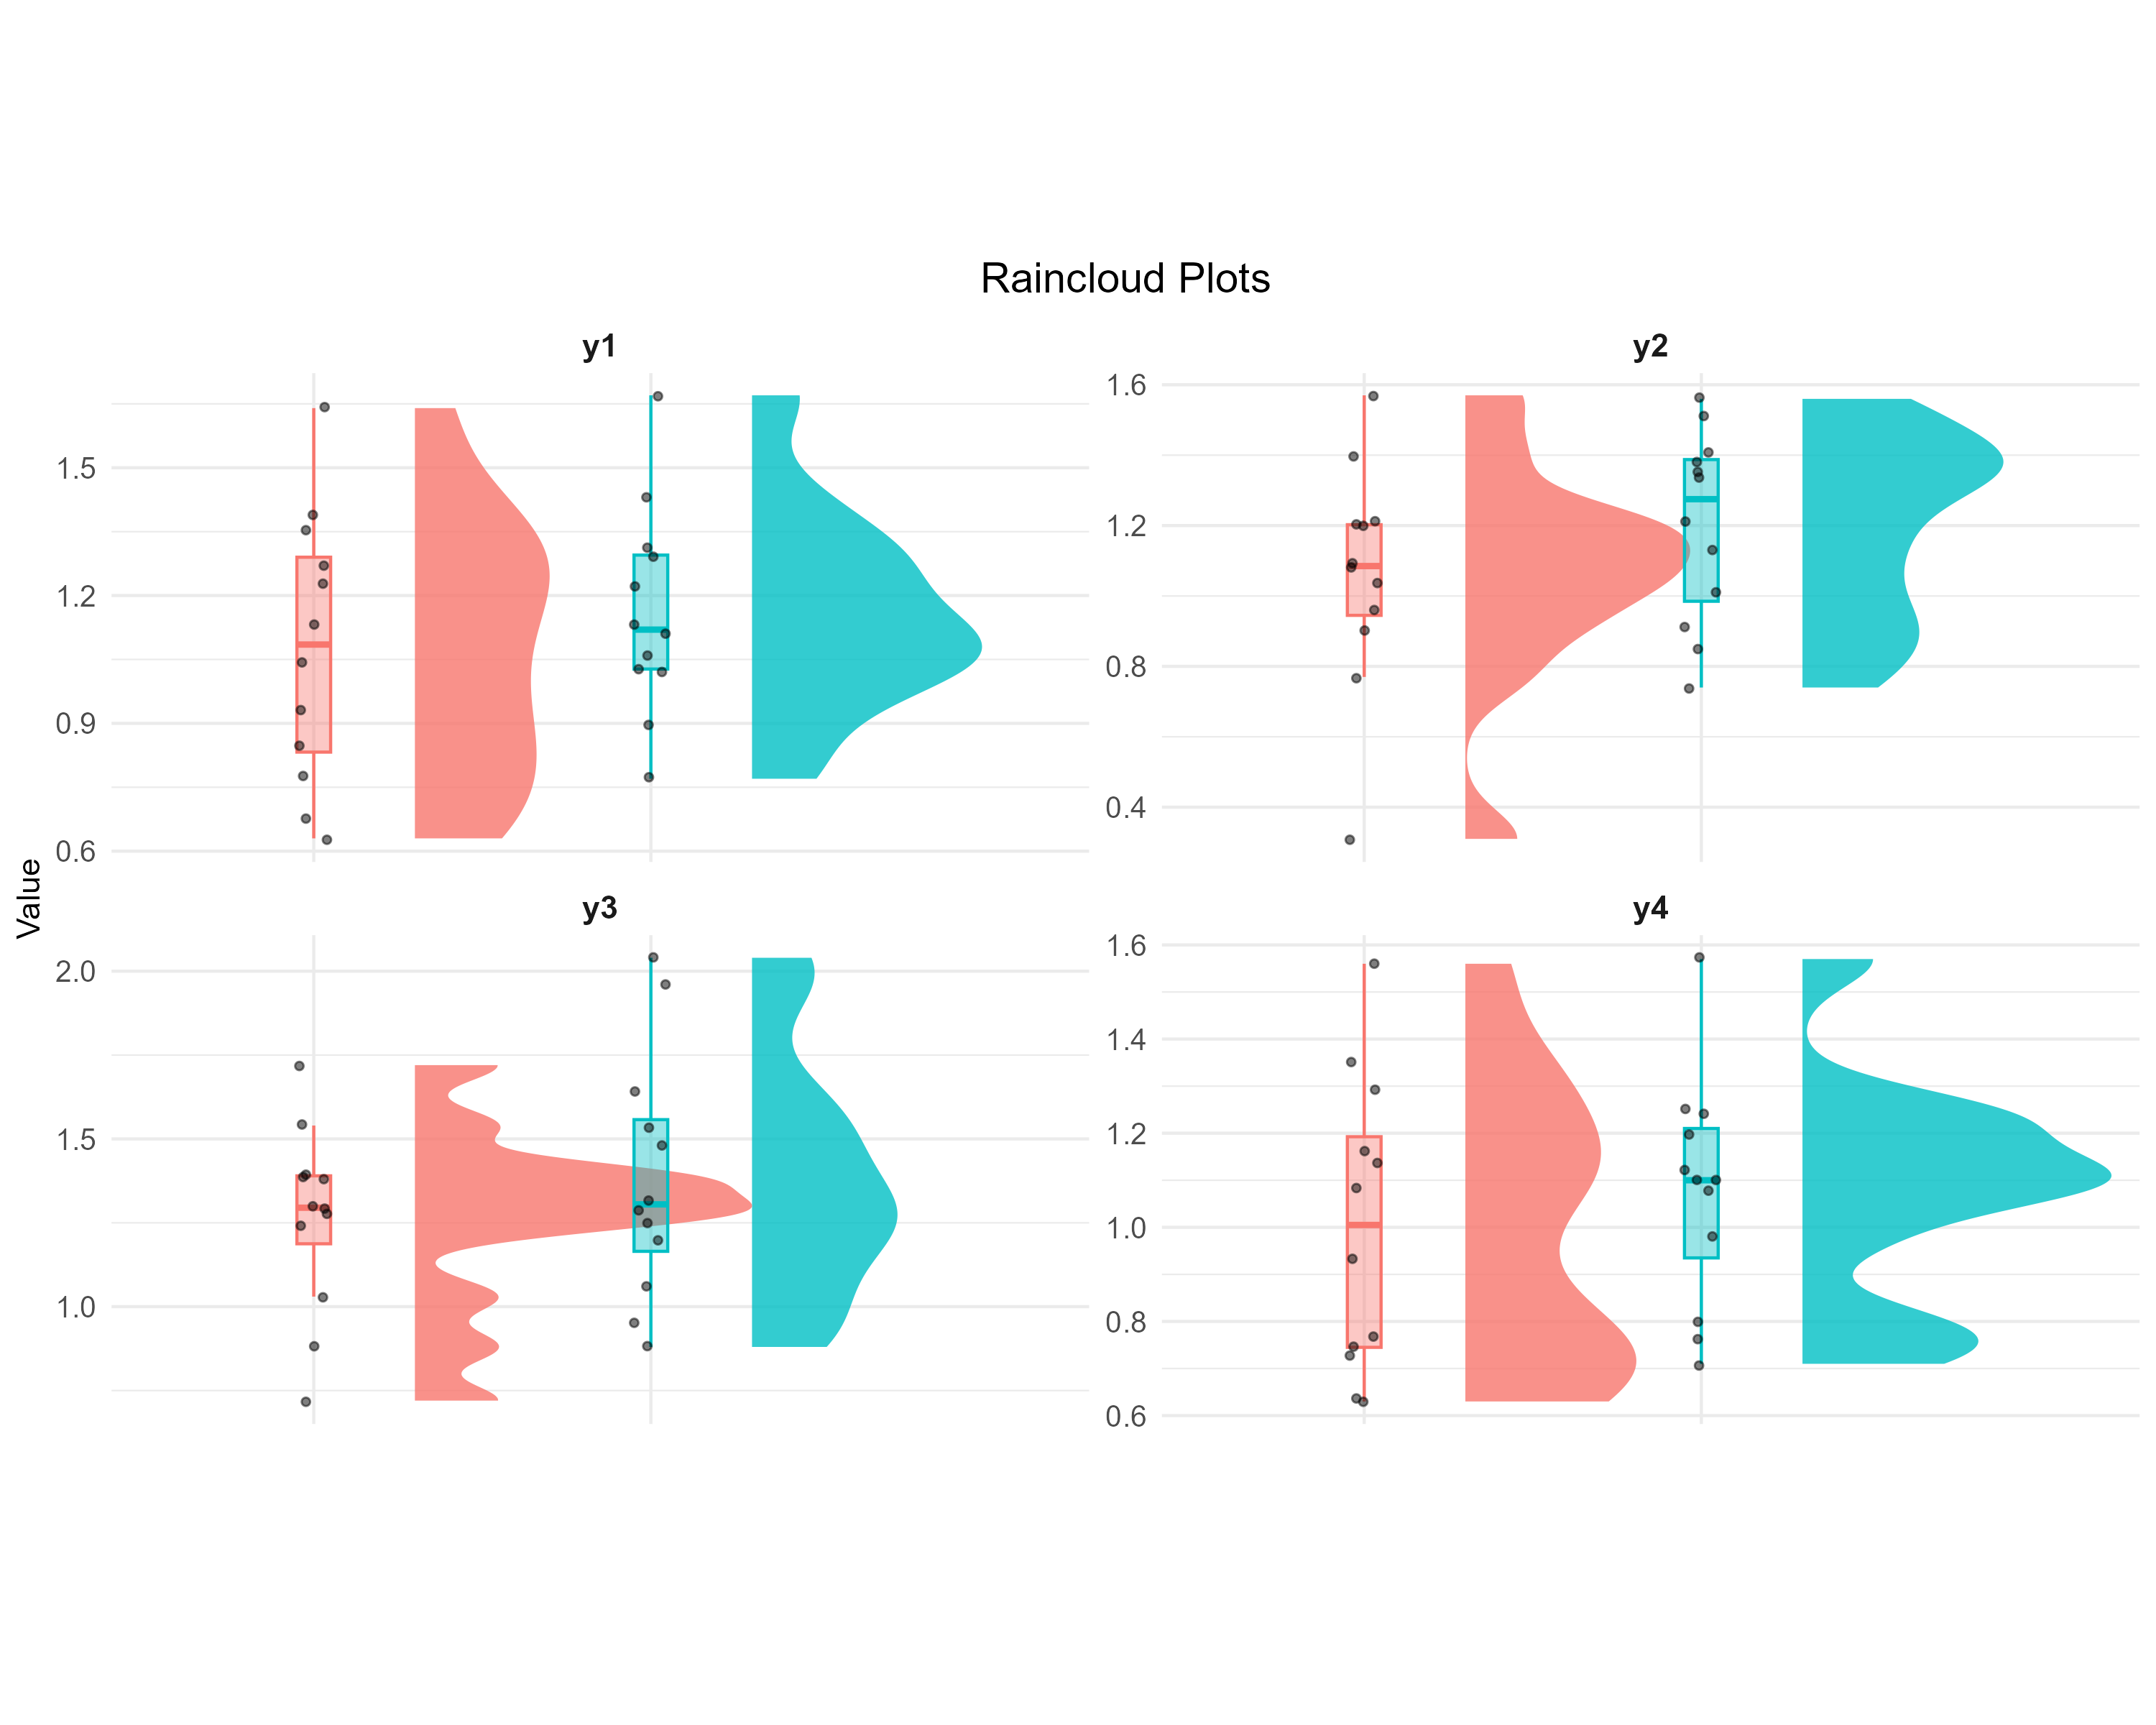
The remaining plots visualize the shape of the data and the relationships between traits. Figure 20 gathers three of them.
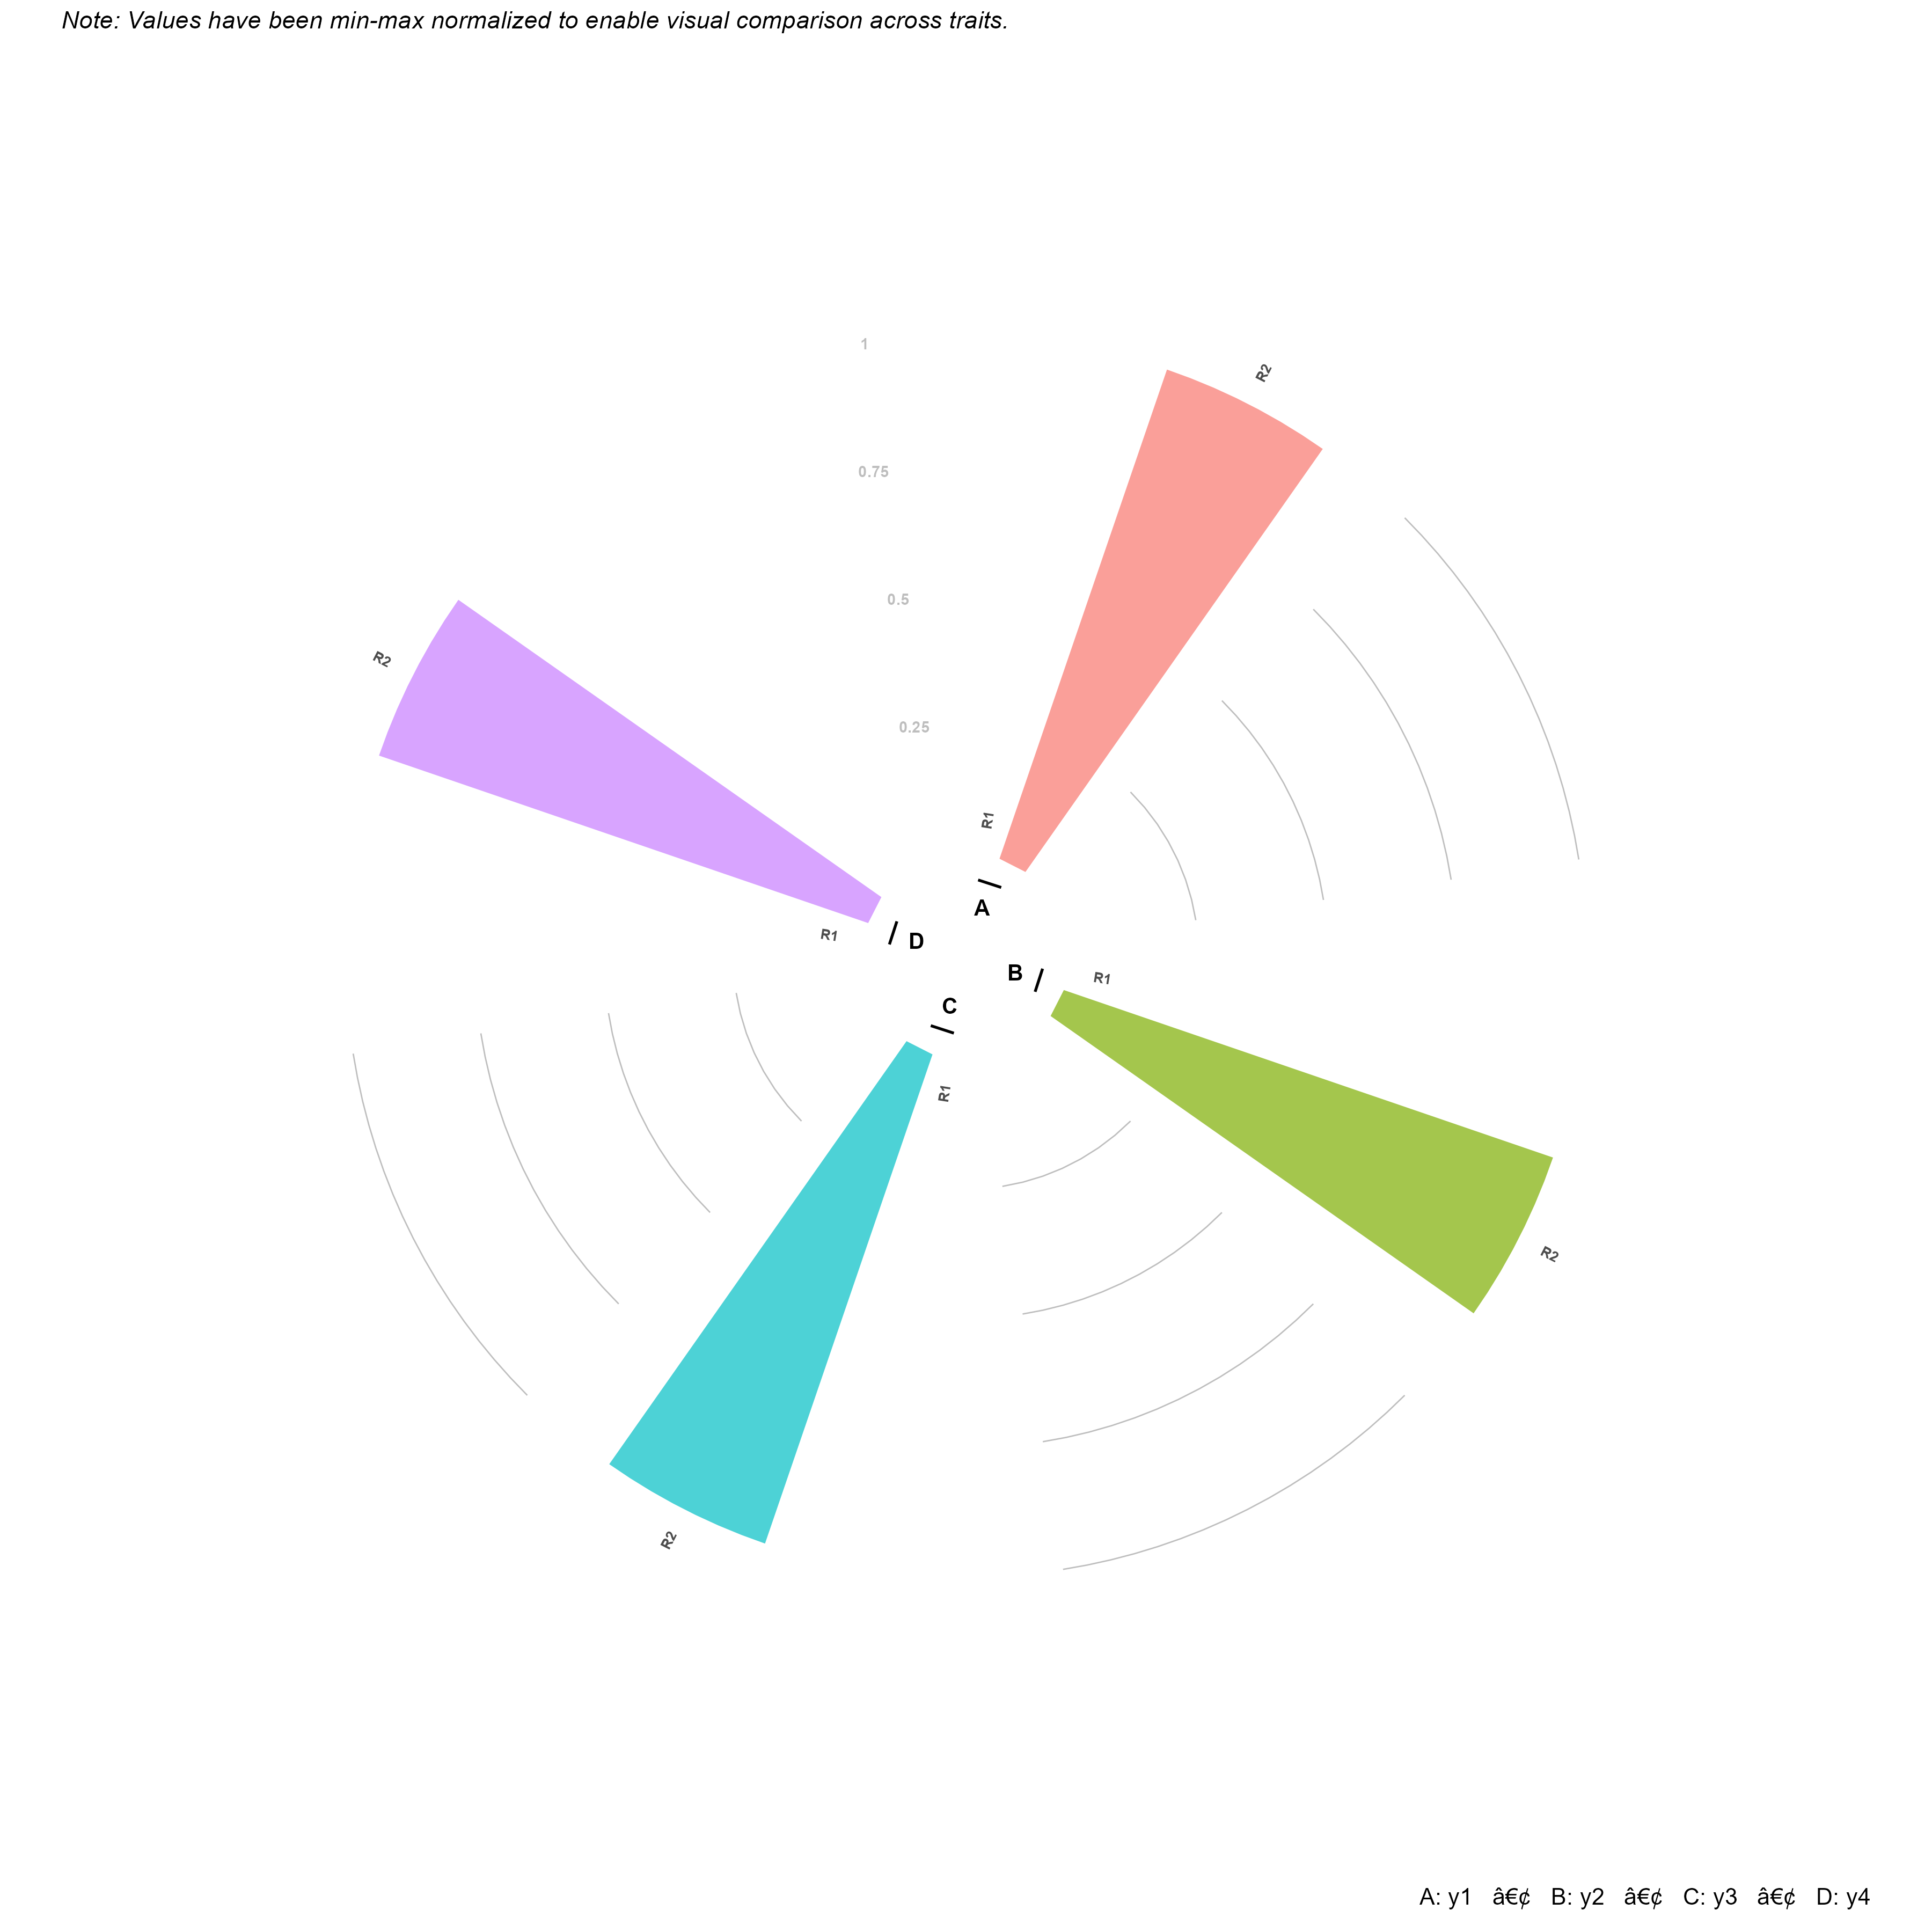
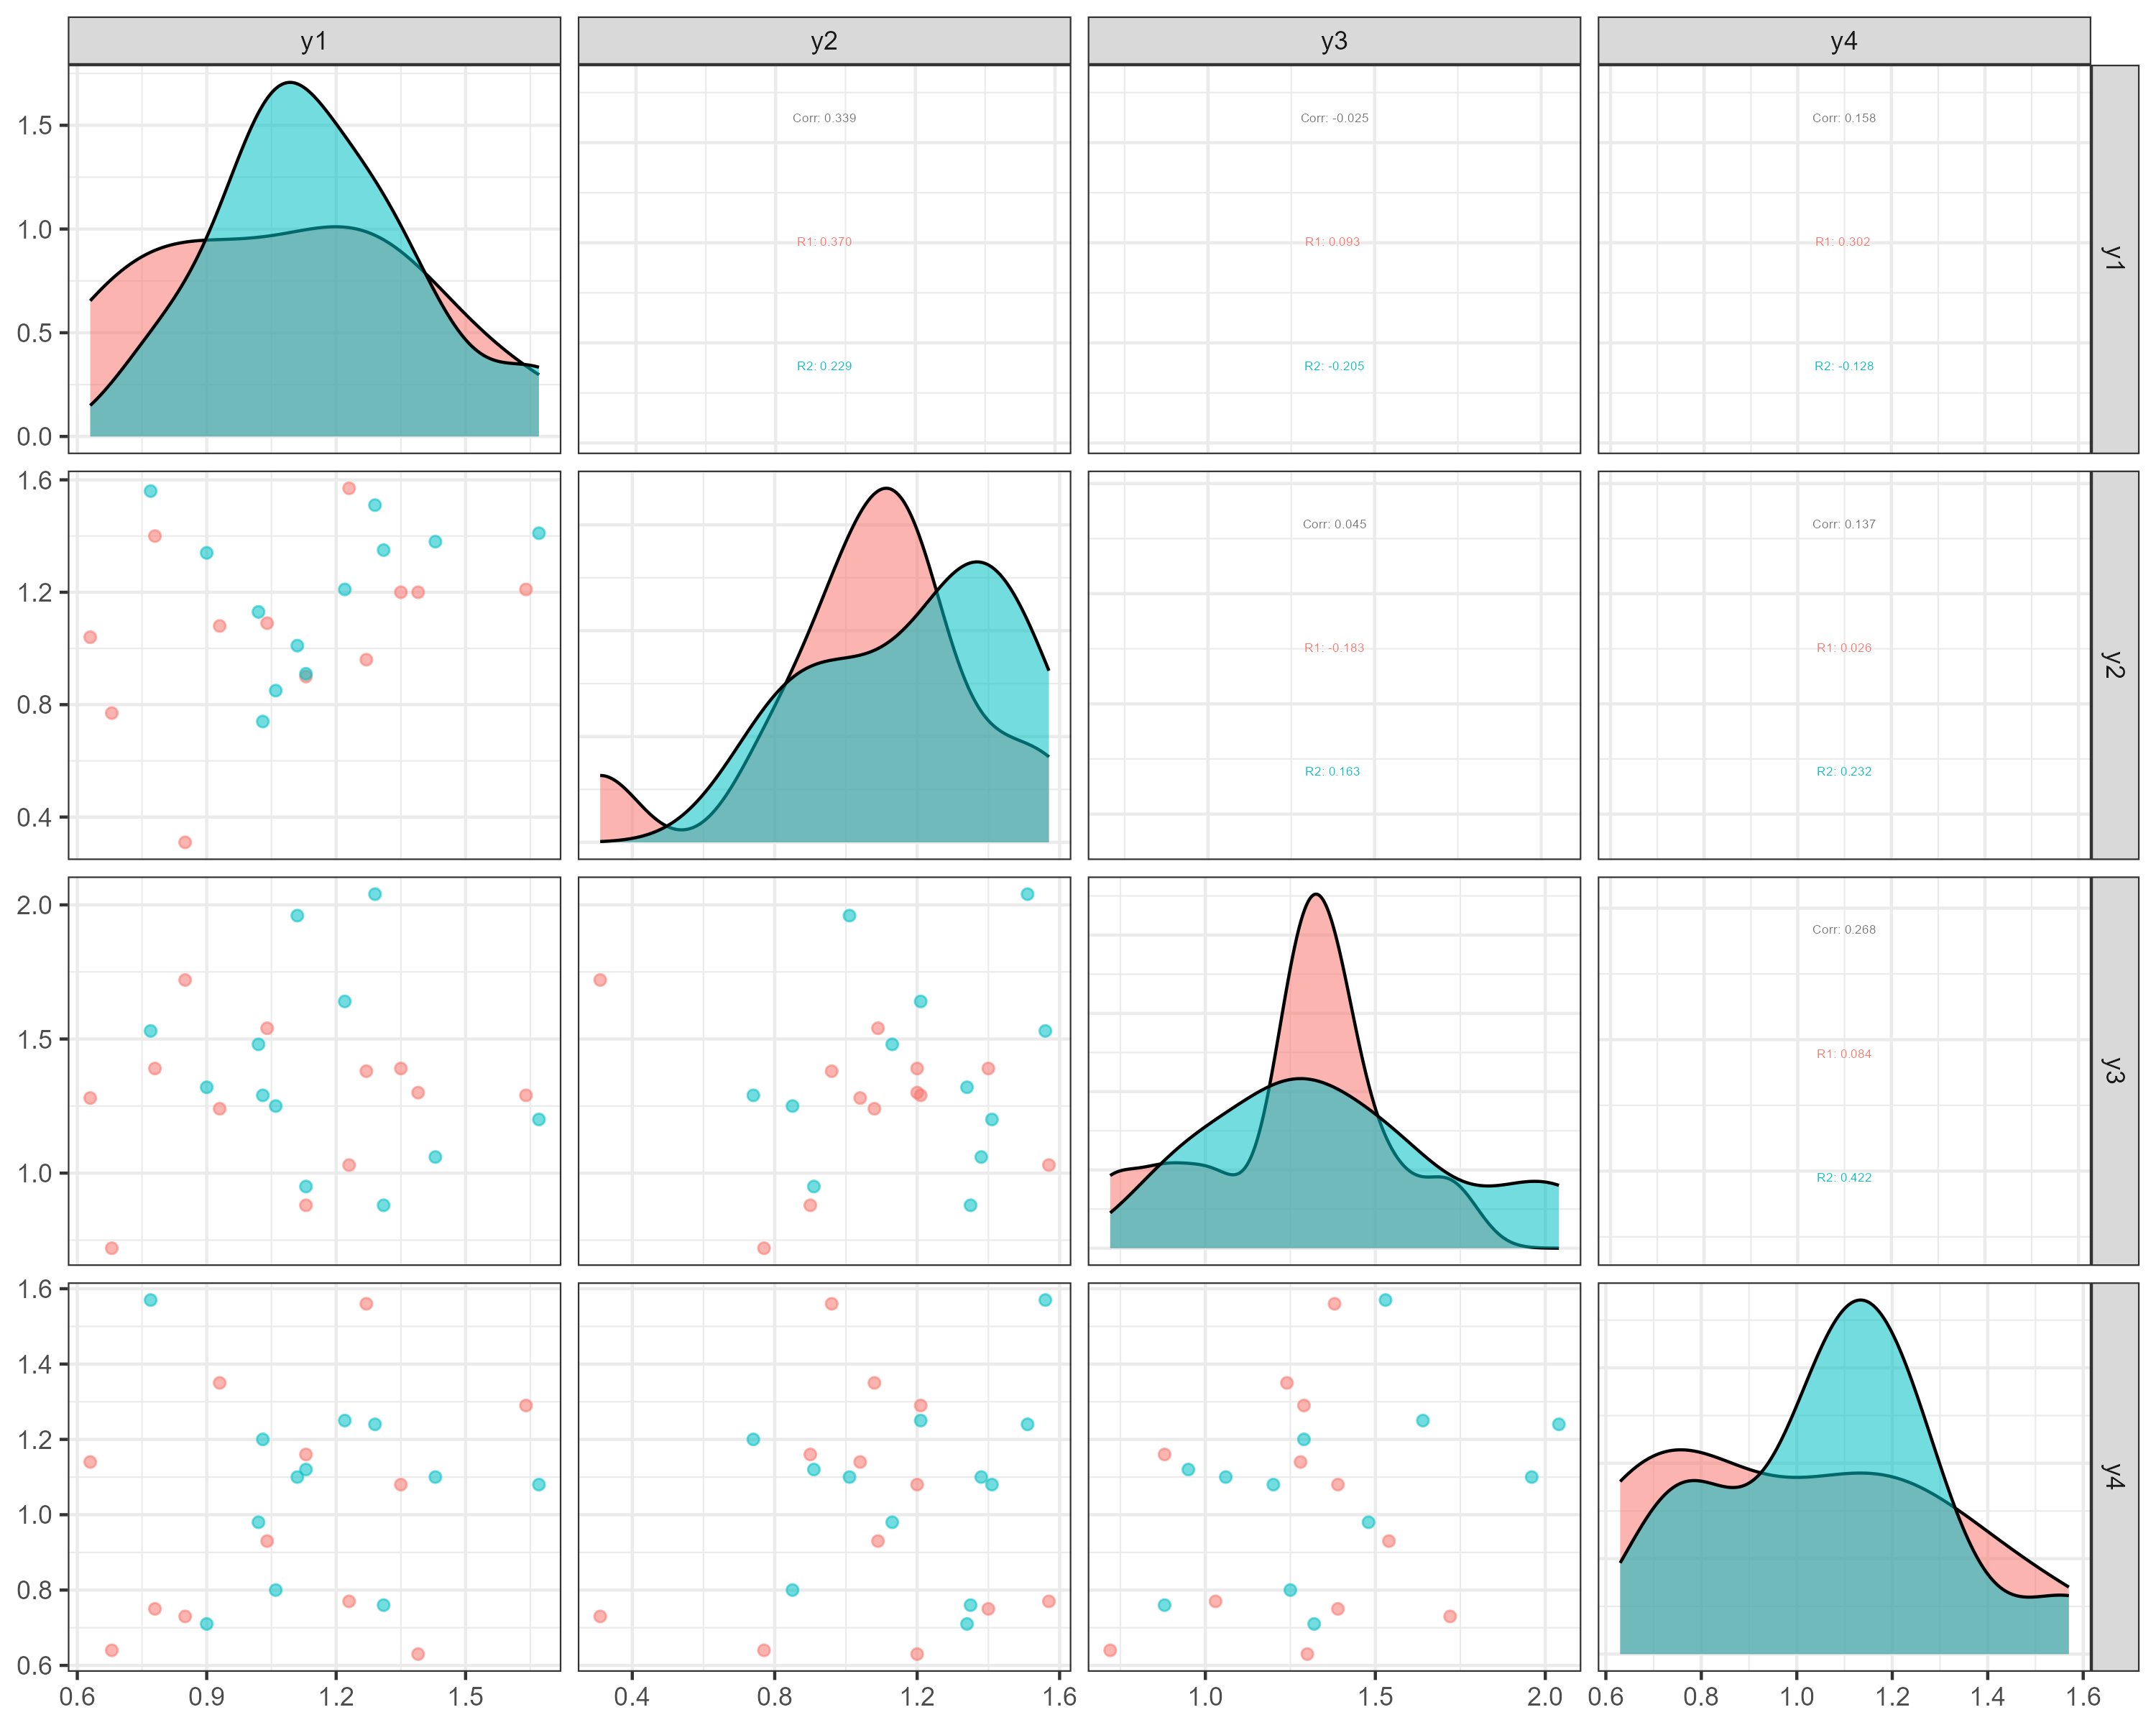
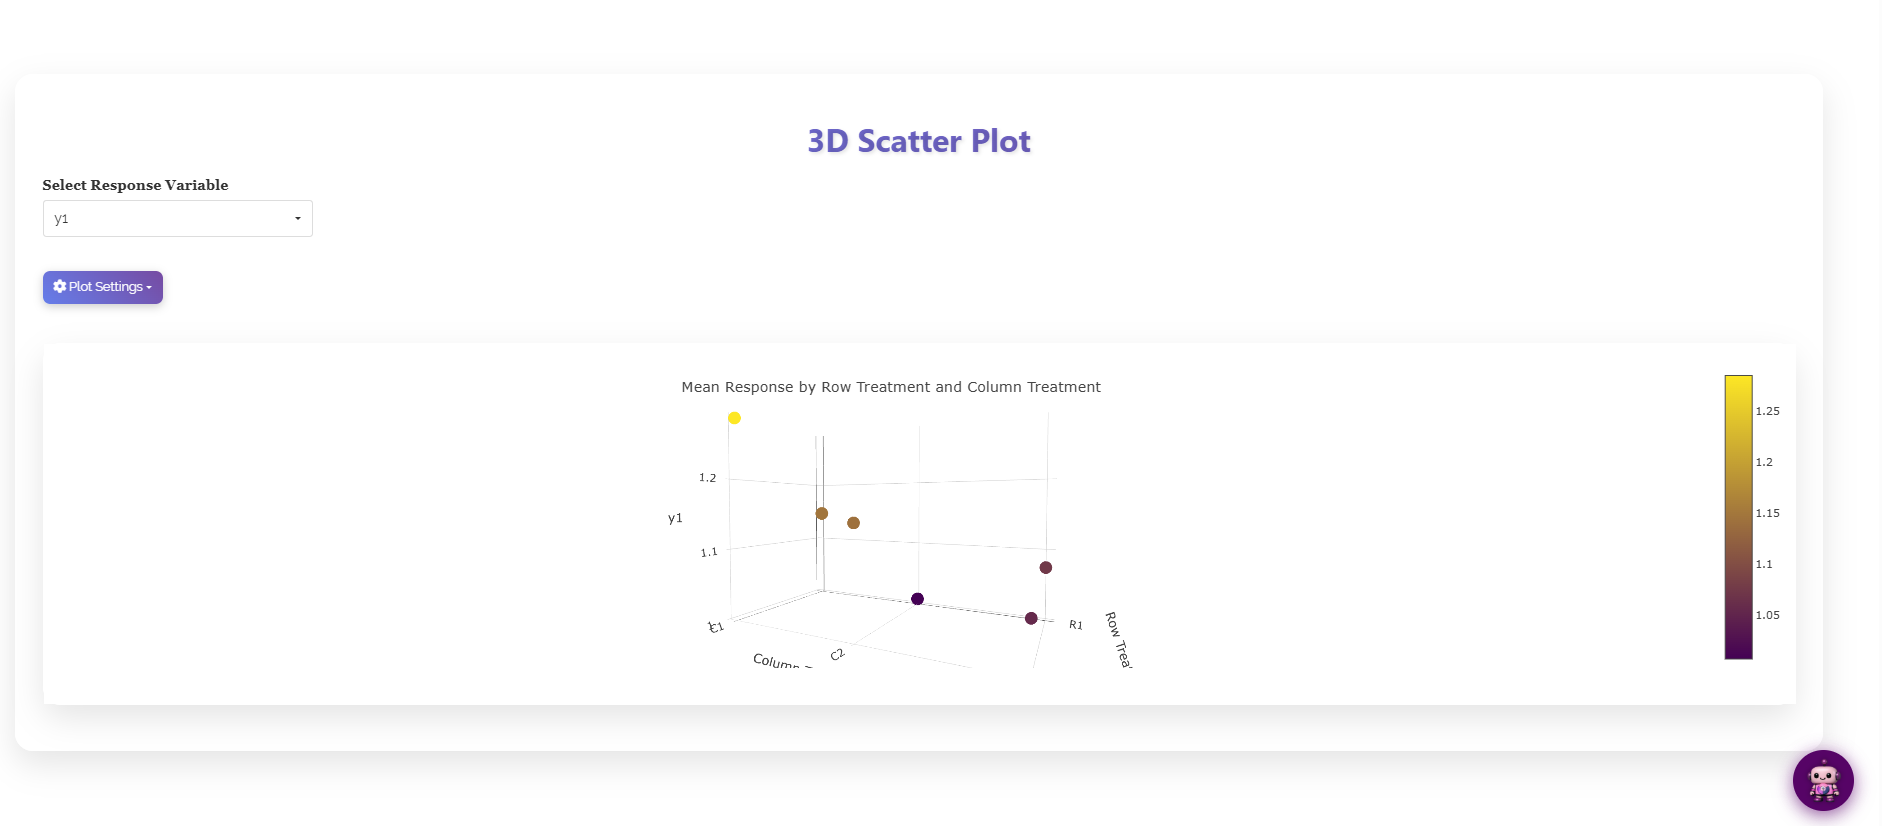
The 3D Scatter Plot (Figure 21) is the natural picture of a crisscross layout, because the two horizontal axes of the plot are the two sets of strips and the vertical axis is the response, so each of the six points sits directly above the intersection it came from. The colour scale doubles the reading of height. The 3D Scatter + Line version connects the points to trace the trend across levels, which makes a crossing interaction easy to see from any angle. The remaining advanced graphics serve the usual supporting roles: the QQ Plot checks the normality assumption by plotting the model residuals against normal quantiles, points hugging the diagonal supporting normality while a pronounced curve or S-shape suggests a transformation (Section 7) may be needed; the Distribution Plot shows the shape of each response directly; and the Correlation Plot is a second view of the pairwise story told by the pair plot.
10 Ranking treatments on all traits: the PCA index
The Analysis Results tab evaluates each response separately. When several responses need to be considered together, the Multivariate tab provides a PCA-based index score. PCA combines information from several responses into a smaller number of components, which can be used to rank treatment combinations. The PCA index is exploratory and should be interpreted separately from the ANOVA results.
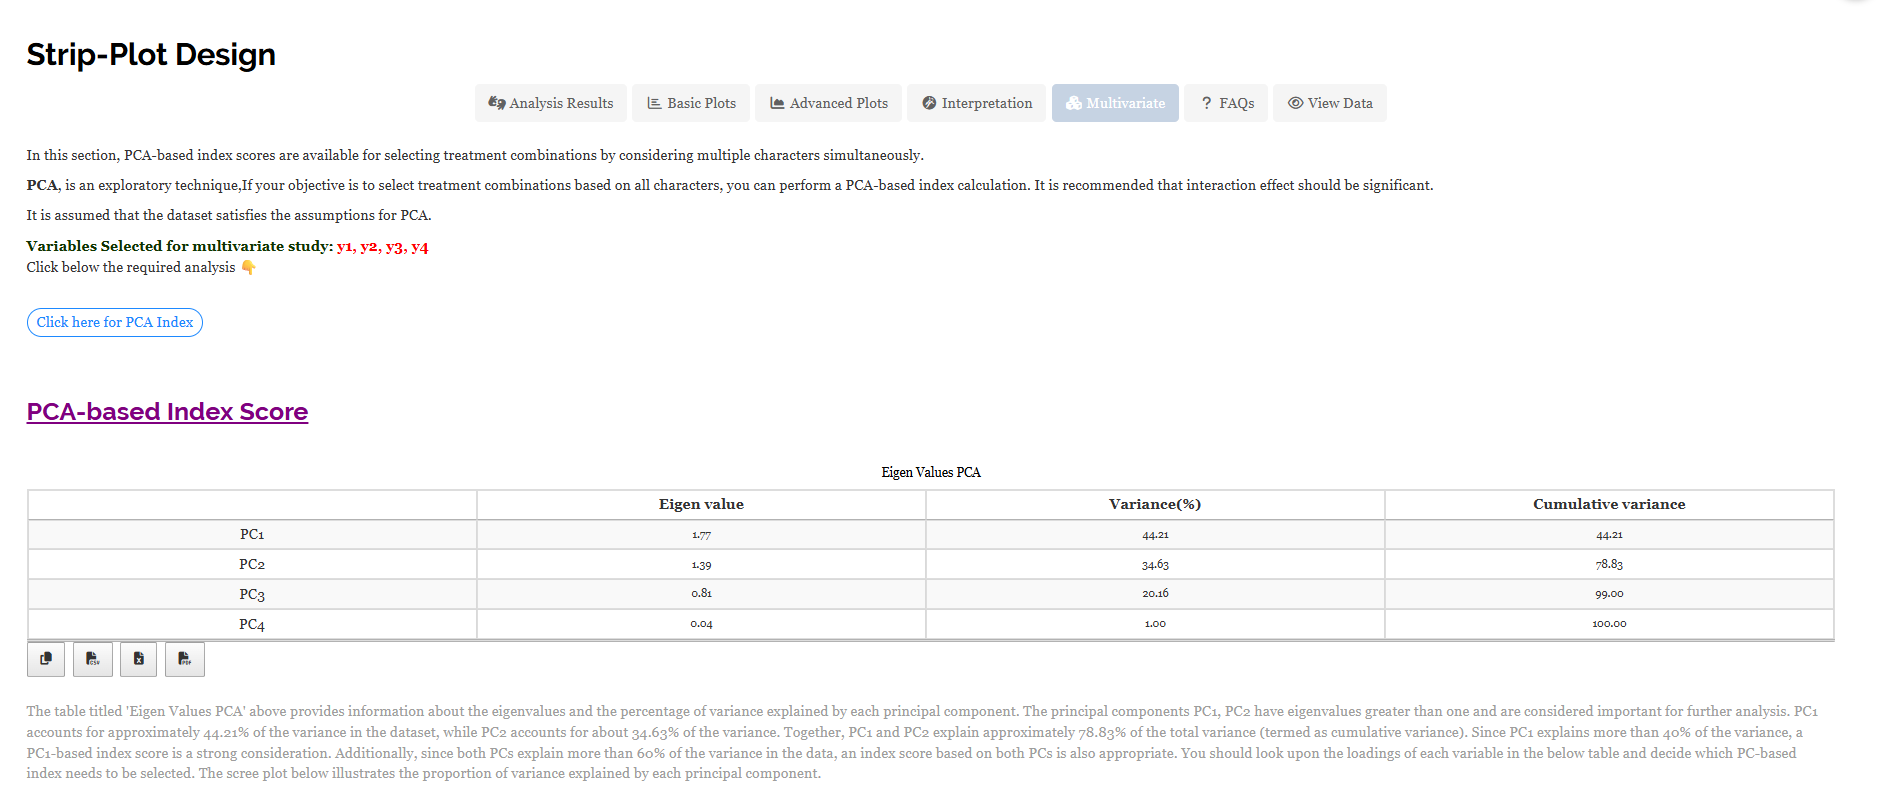
The eigenvalue table (Figure 22) helps determine the number of components to retain. In this example, PC1 has an eigenvalue of 1.77 and explains 44.21% of the variance, while PC2 has an eigenvalue of 1.39 and explains a further 34.63%. Together, they explain 78.83% of the total variance. PC3 and PC4 explain smaller proportions of the variance.
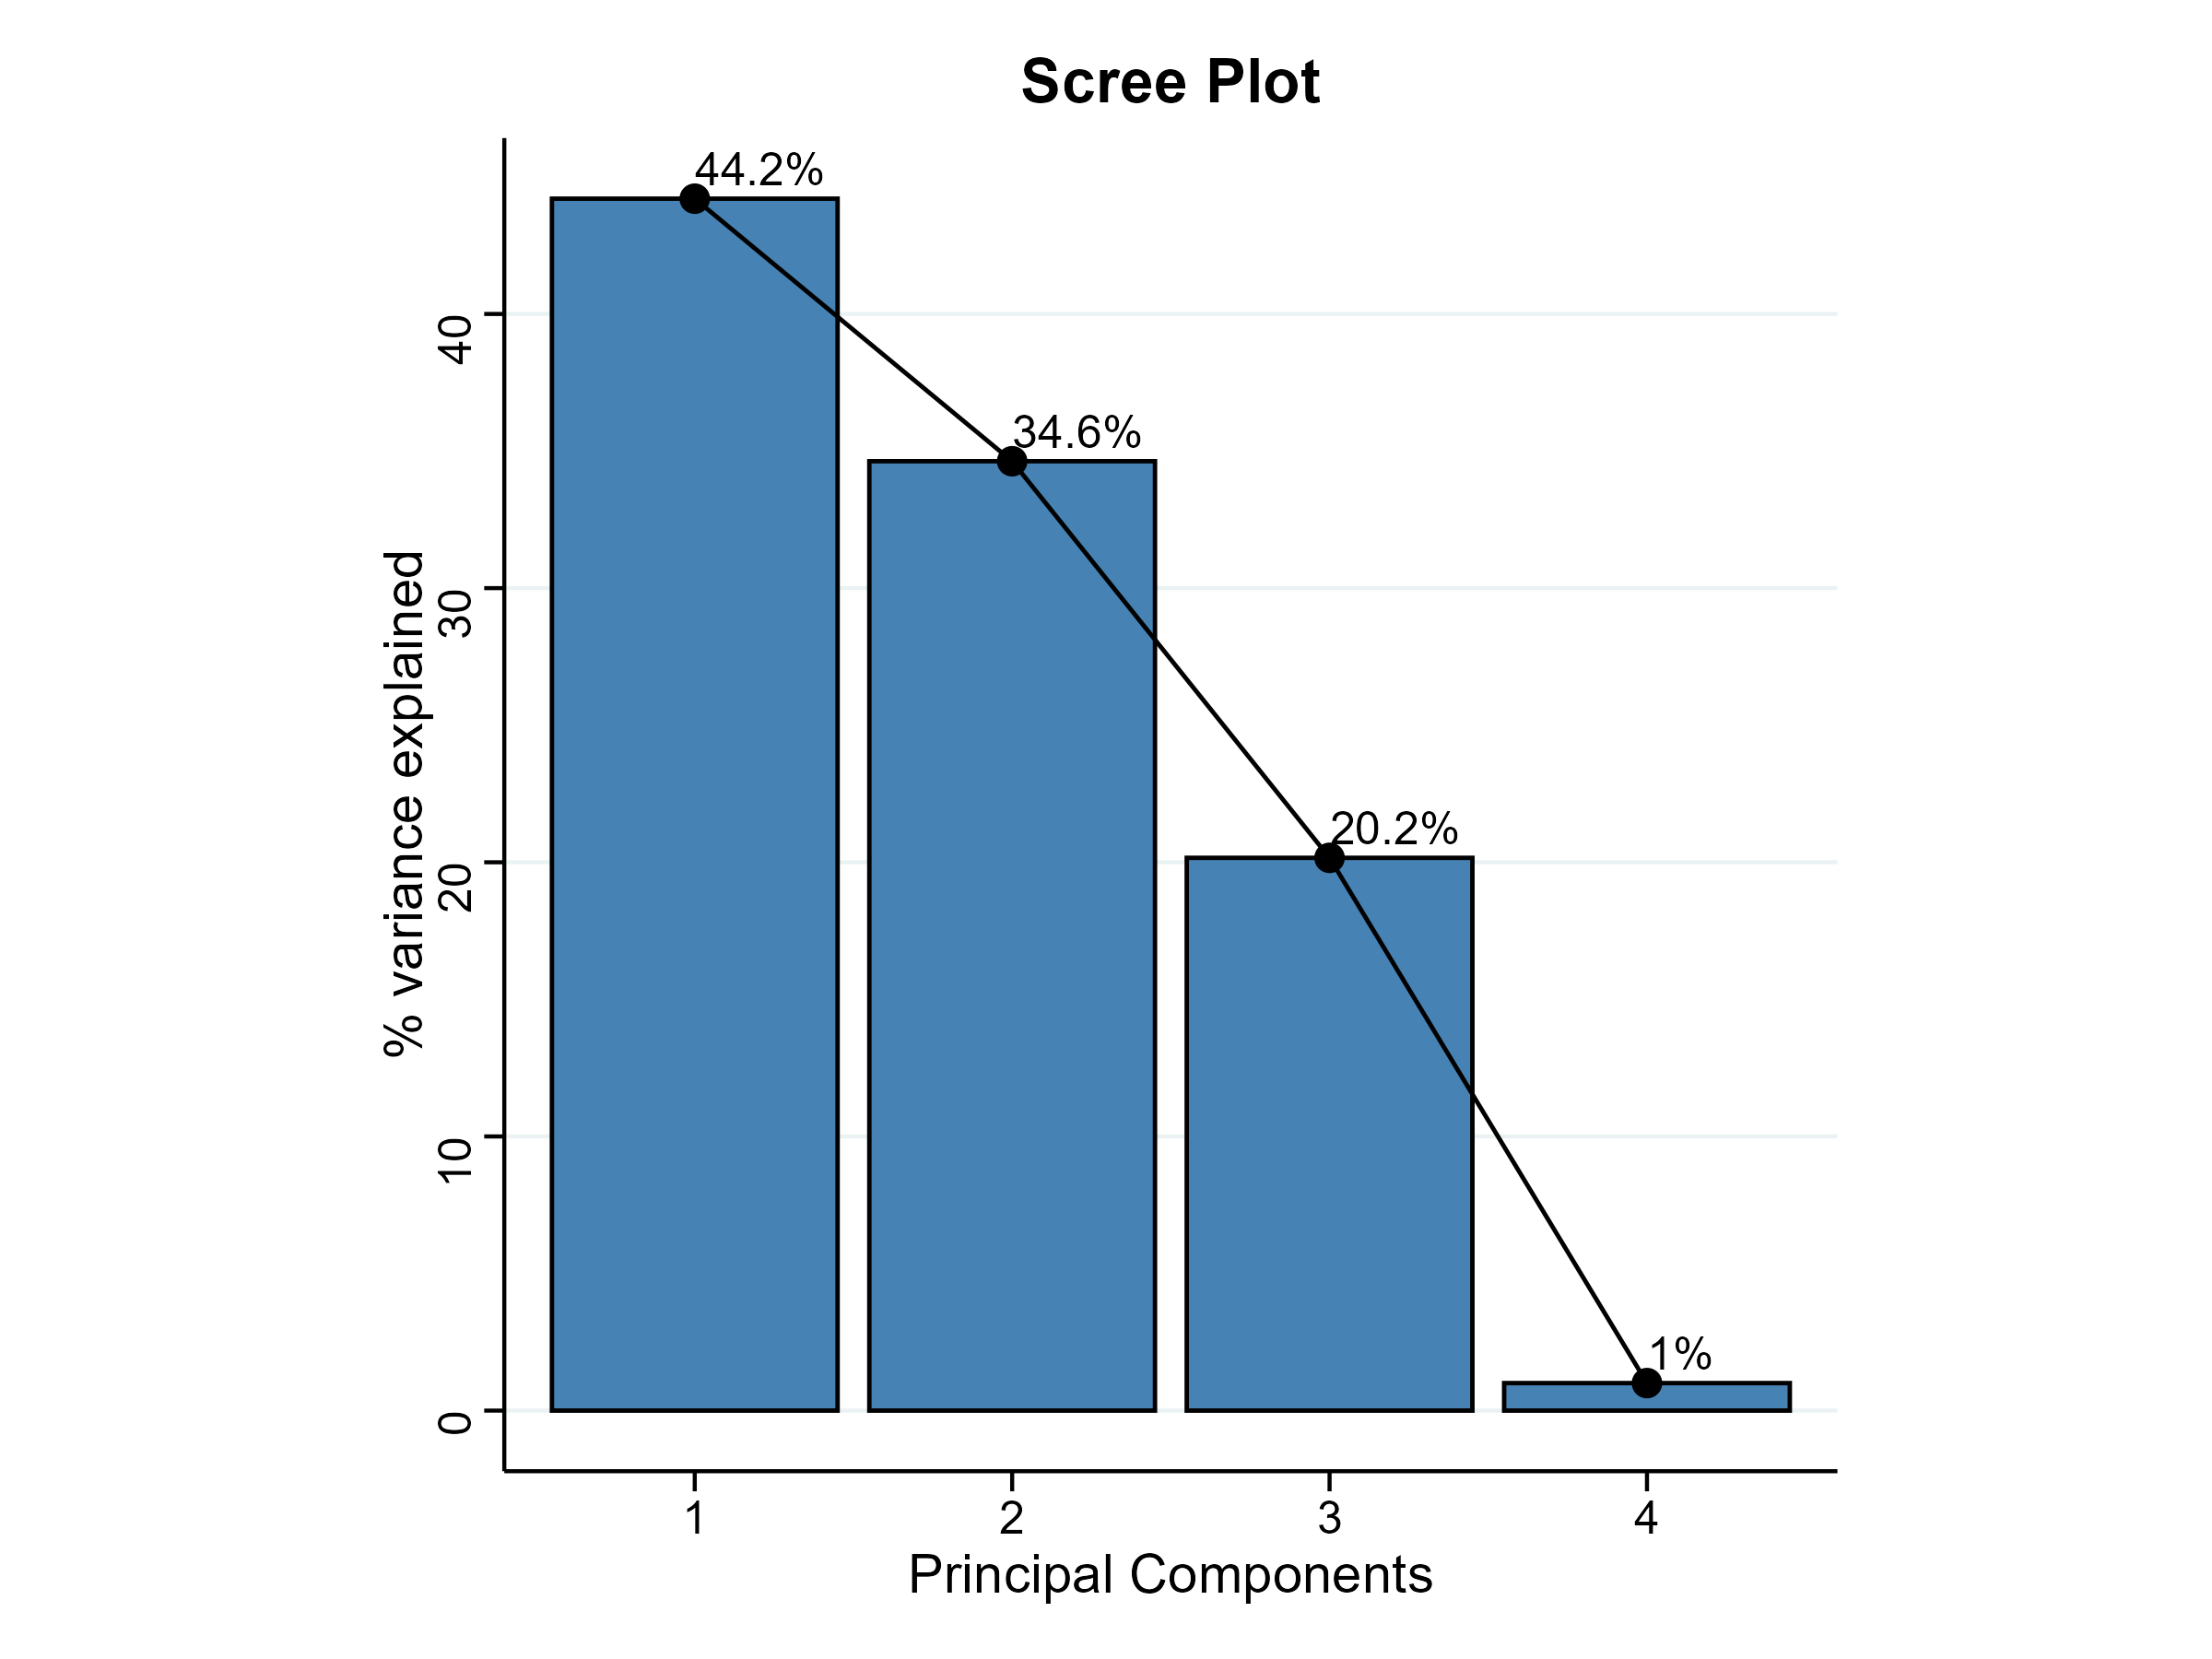
The scree plot (Figure 23) shows the same information graphically, and the reason to look at both is that the picture makes the shape of the decline obvious in a way the table does not. Here the bars fall from 44.2% to 34.6% to 20.2% and then collapse to 1%. There is no sharp elbow between the first three components, but there is a very sharp one before the fourth, which tells you that essentially all the structure in these four traits lives in the first three components and that the fourth may be disregarded entirely.
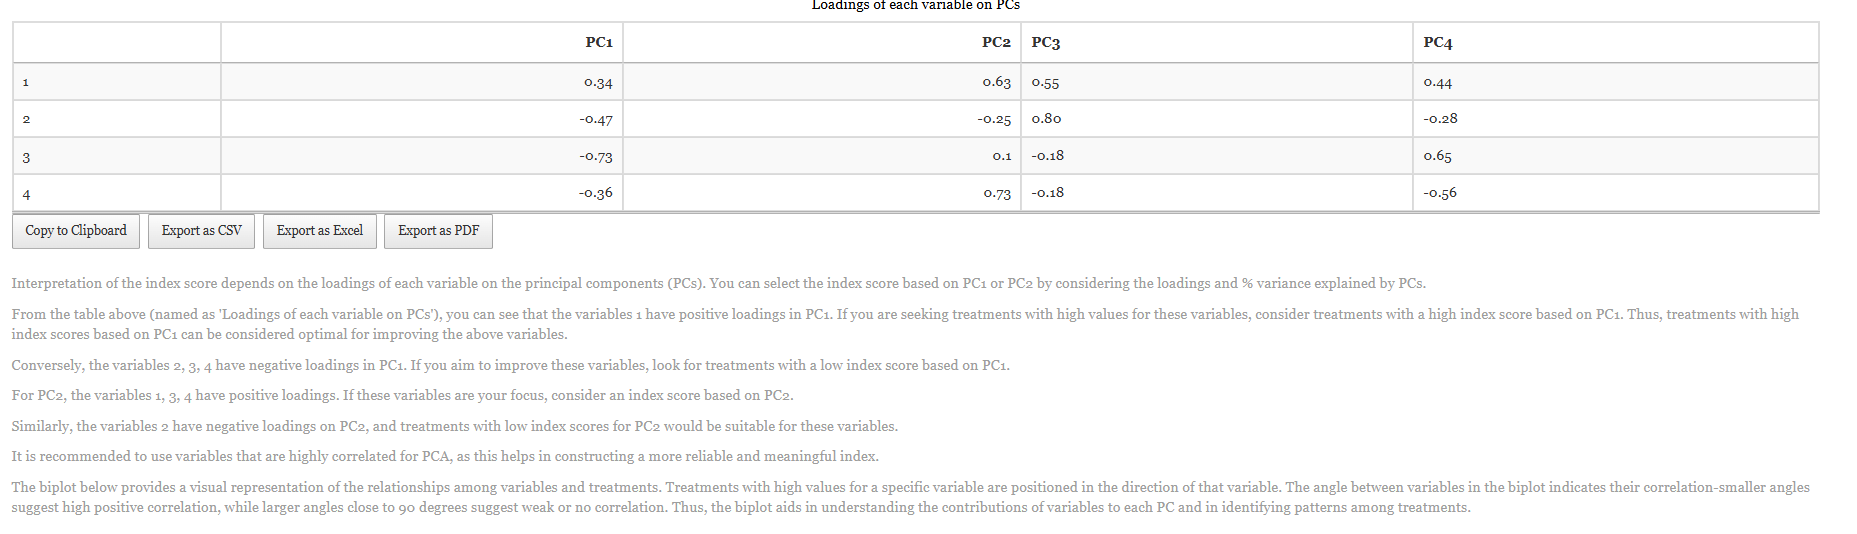
The loadings table (Figure 24) tells you what each component means, and it must be read before any index is used. A loading is the weight a variable carries on a component: variables with large positive loadings push a treatment’s score up, variables with large negative loadings push it down. On PC1, variable 1 is the only one with a positive loading (0.34) while variables 2, 3 and 4 are all negative, the strongest being variable 3 at -0.73, followed by variable 2 at -0.47 and variable 4 at -0.36. On PC2 the split runs differently: variables 1, 3 and 4 load positively (variable 4 most strongly at 0.73, then variable 1 at 0.63 and variable 3 at 0.1) while variable 2 loads negatively at -0.25.
The practical consequence, spelled out by RAISINS beneath the table, is that the direction of the index depends on which traits you are trying to improve. If you want high values of variable 1, choose treatments with a high PC1 index score; if you want high values of variables 2, 3 and 4, look instead for a low PC1 score. There is no universally good end of a component, only an end that matches your breeding or production objective.
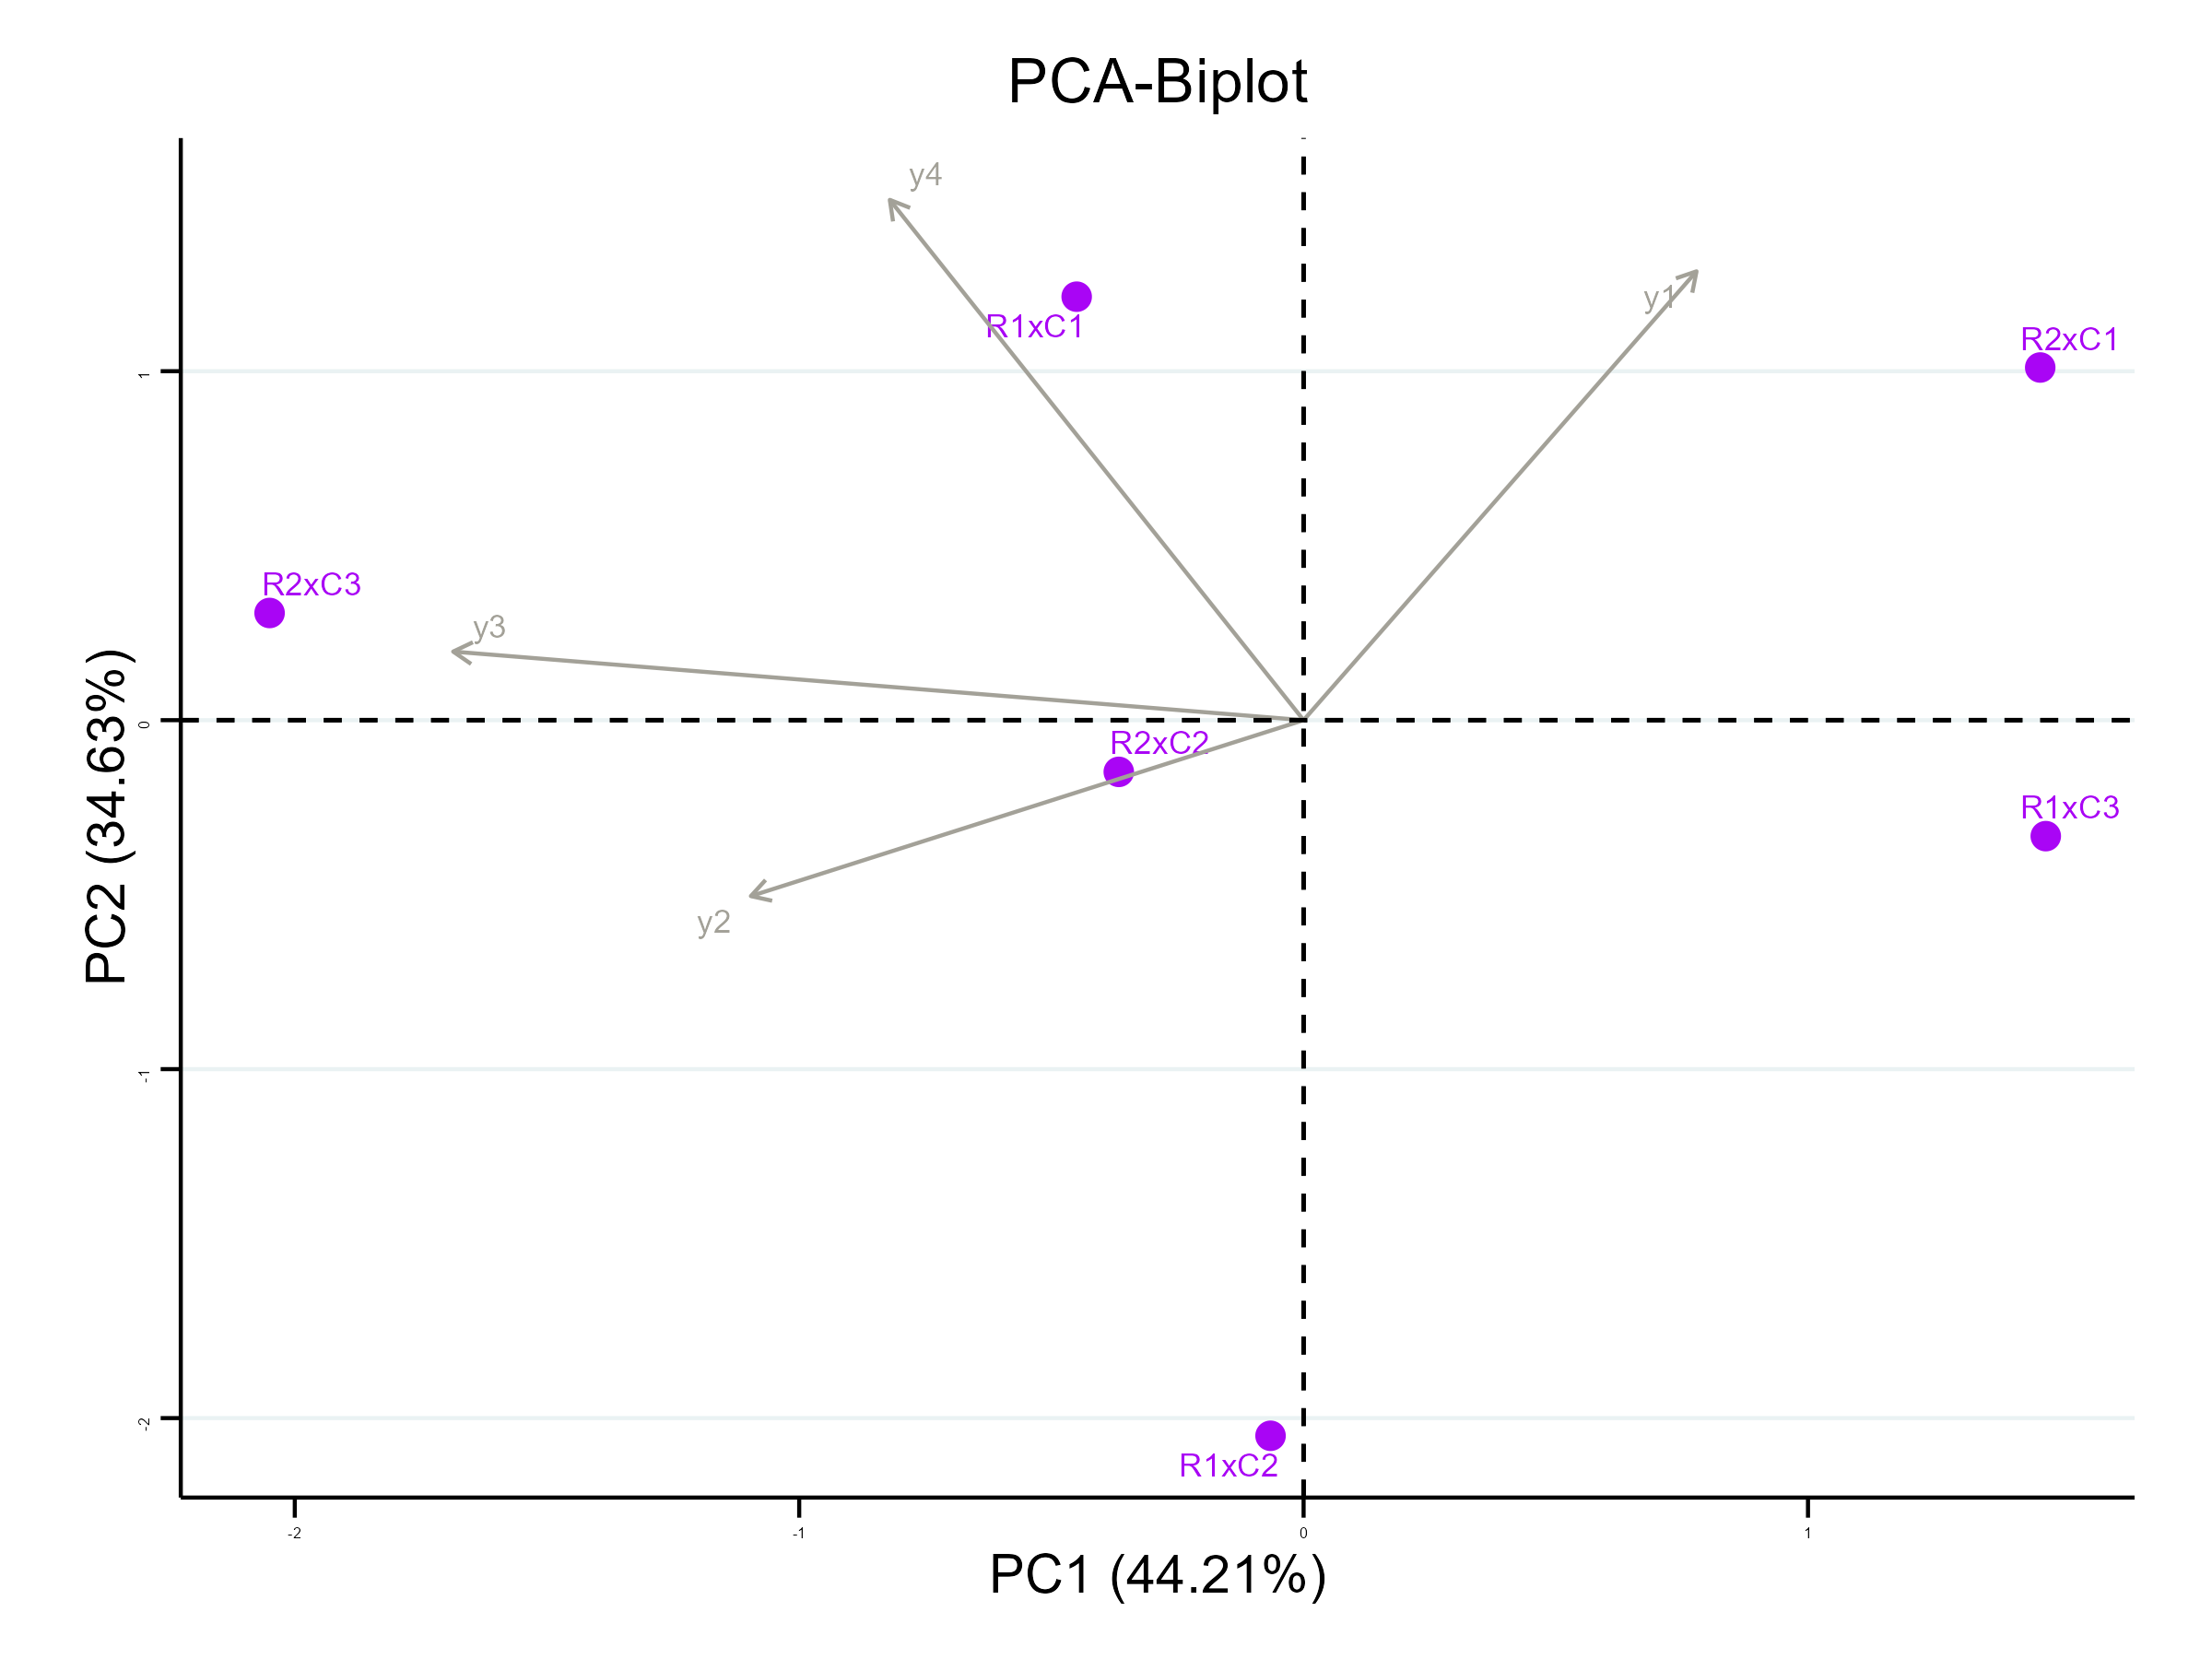
The biplot (Figure 25) puts the loadings and the treatment scores on one pair of axes. Treatments with high values for a particular trait are positioned in the direction of that trait’s vector, and the angle between two vectors indicates their correlation: a small angle means the two traits move together, an angle near 90 degrees means they are largely unrelated. It is the quickest way to see which traits are carrying the index and which treatments the index is separating.
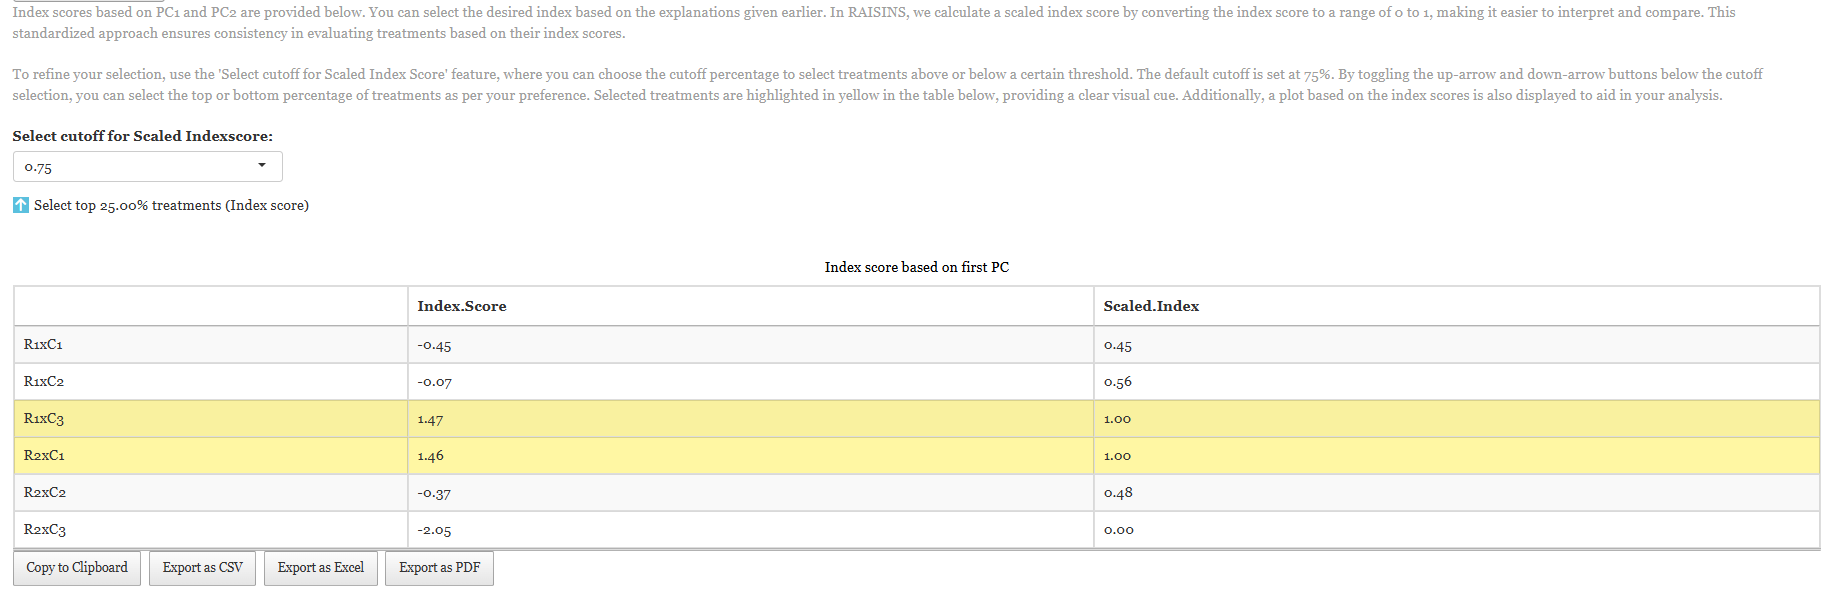
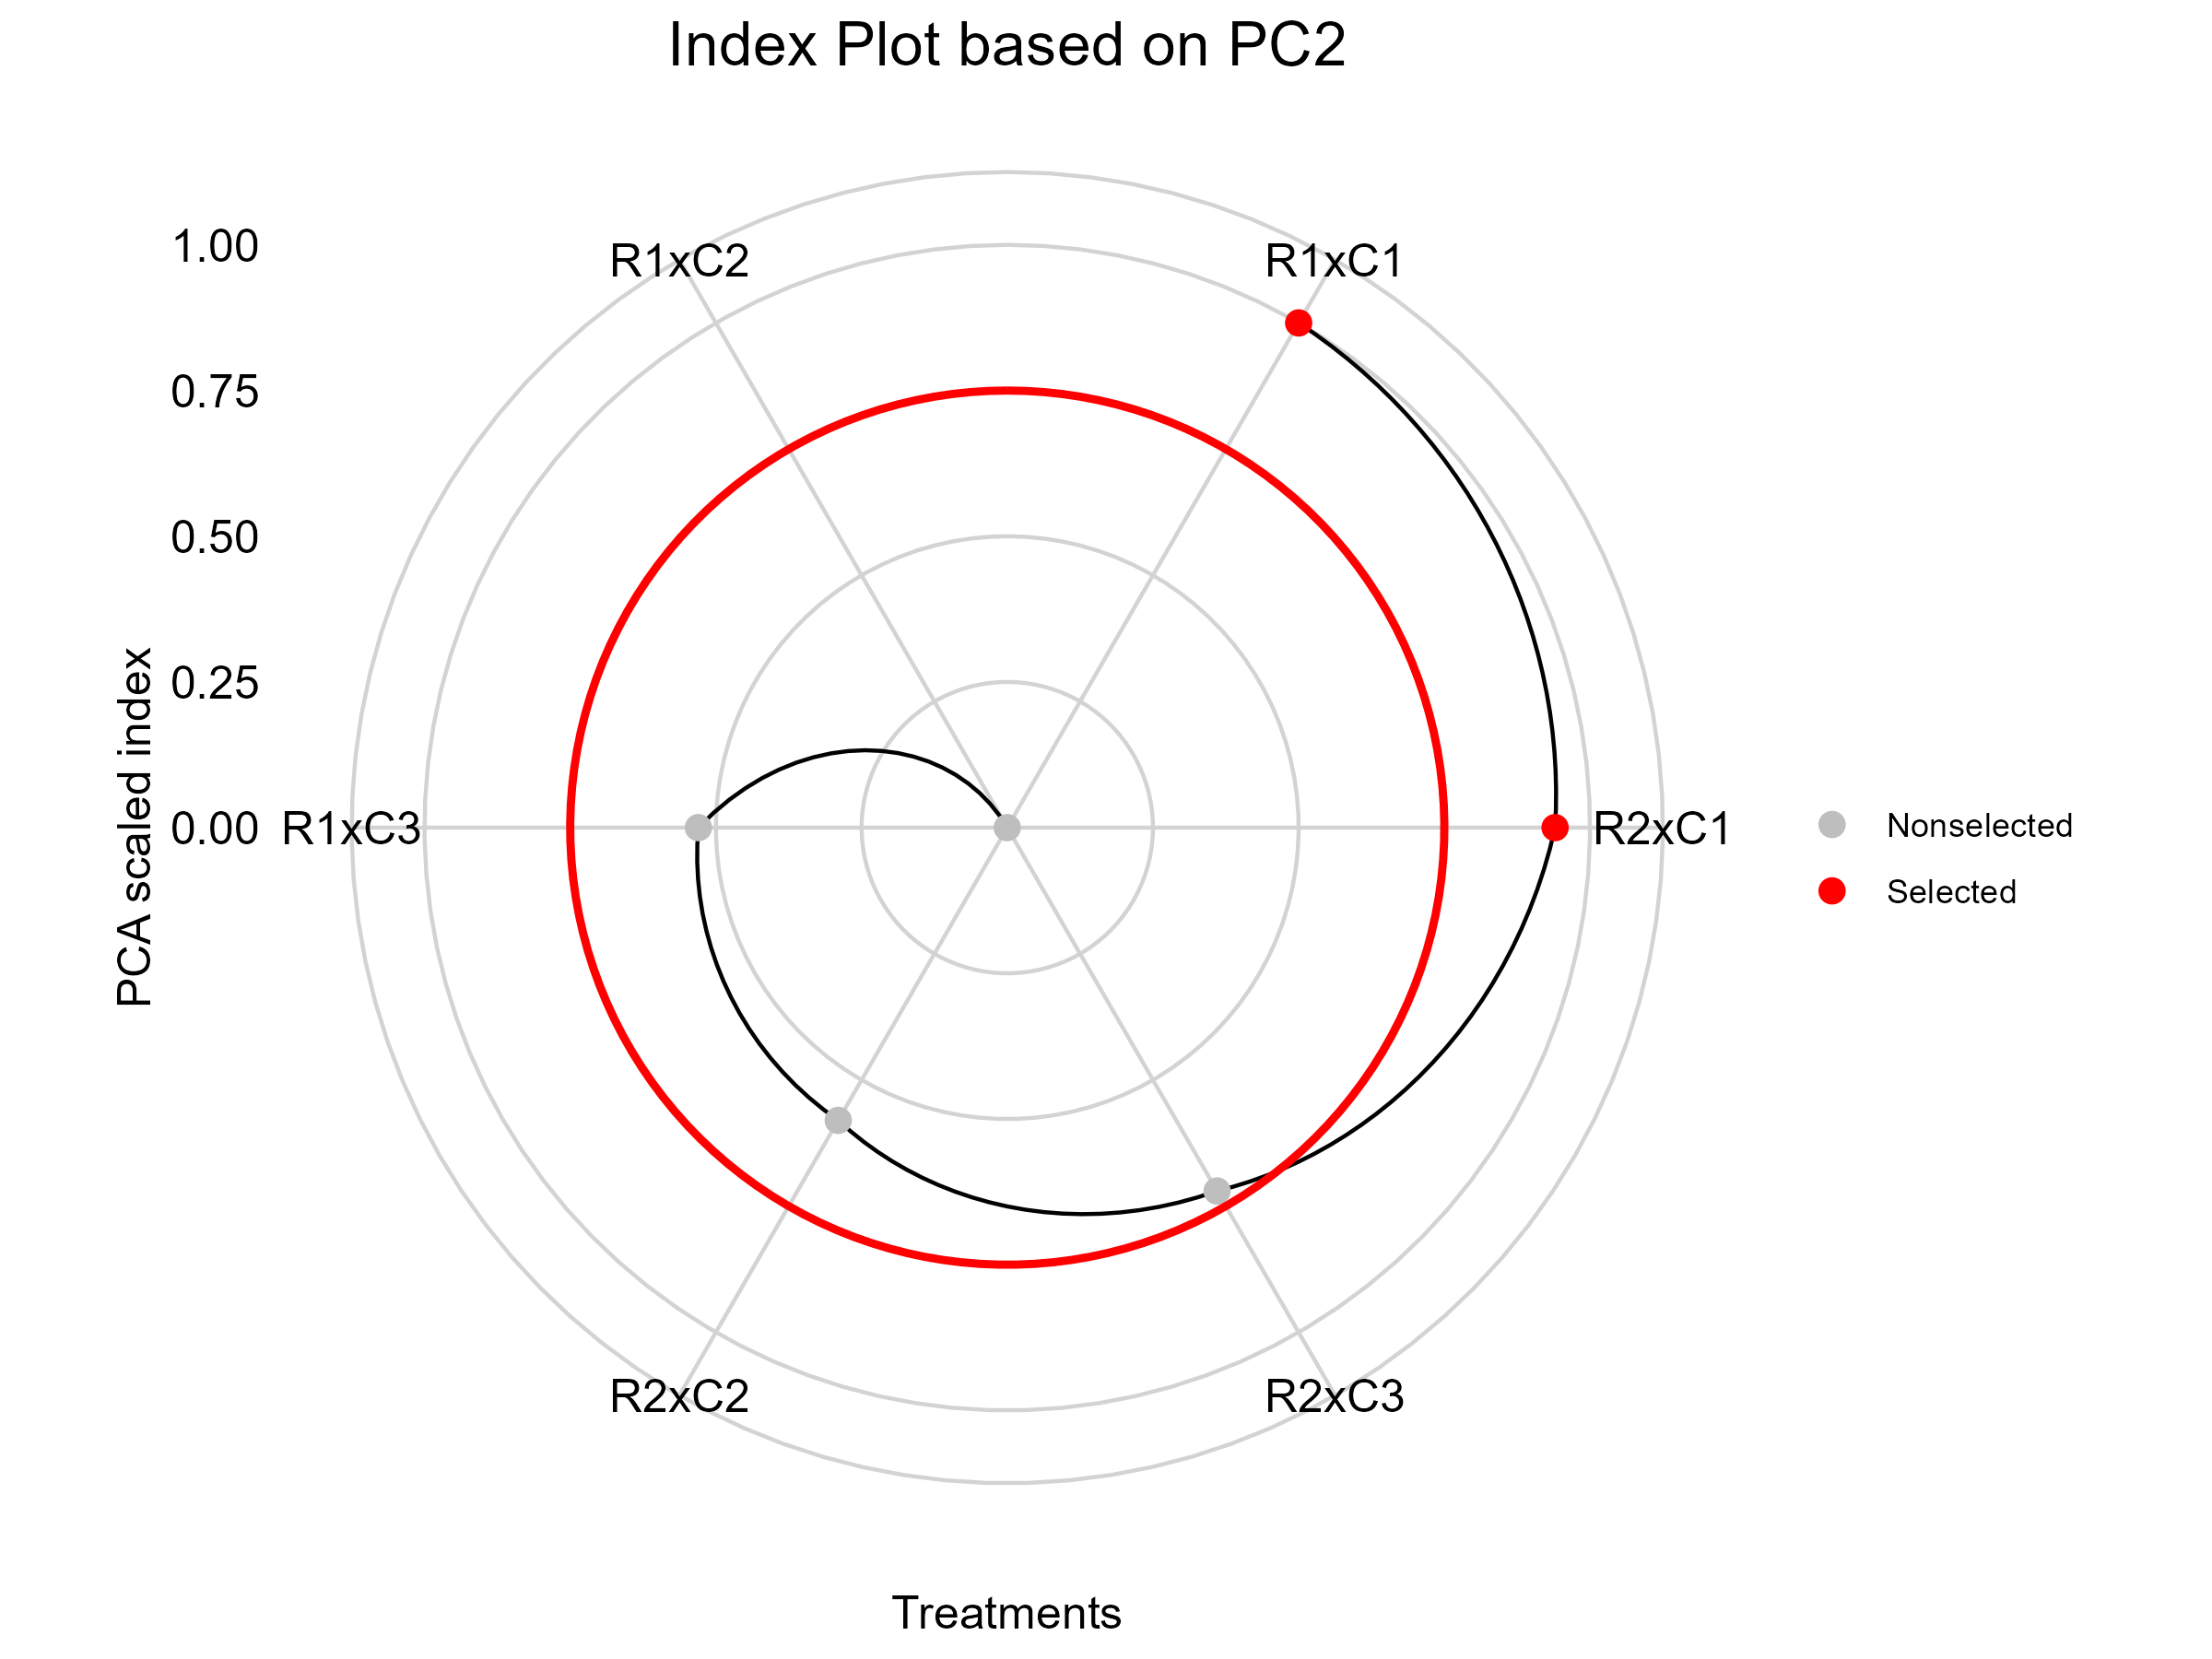
Finally, RAISINS converts the chosen component into a score for every treatment combination and scales it to a 0 to 1 range (Figure 26 (a)). The Select cutoff for Scaled Indexscore control decides how many are highlighted; it is set to 0.75 here, which selects the top 25% of treatments, and the chosen rows are shaded yellow in the table while the cutoff itself is drawn as a red ring in Figure 26 (b), with the selected treatments marked in red on it. On the index based on the first PC, R1xC3 and R2xC1 tie at the top with raw scores of 1.47 and 1.46 and a scaled index of 1.00 apiece, followed by R1xC2 (-0.07, scaled 0.56), R2xC2 (-0.37, scaled 0.48) and R1xC1 (-0.45, scaled 0.45); R2xC3 sits at the bottom with a raw score of -2.05 and a scaled index of 0.00.
That last line deserves a second look, because it is a useful corrective. R2xC3 is the combination that won the y3 comparison outright, carrying the letter a and the highest cell mean in Figure 12, and it is last on the PC1 index. There is no contradiction. The index is a weighted blend of all four traits with the weights given in Figure 24, and on PC1 three of the four variables carry negative loadings, so a combination that scores high on those traits is pushed to the bottom of this particular index. The two analyses answer different questions, and both answers are correct.
The PCA index is exploratory, not inferential. It produces an ordering of treatments, but no p value, no critical difference and no statement that one treatment is significantly better than another. Nothing in Figure 26 (a) contradicts the finding of Section 8 that only y3 showed a significant effect; the index is answering a different question. Use it to shortlist candidates for a follow-up experiment, and be especially careful with it here, where three of the four traits produced no significant differences at all, so the index is ranking treatments largely on variation the ANOVA could not distinguish from noise.
The index plot and the score table each name the component they are based on, and they can be switched independently: in the pair above, the table is headed Index score based on first PC while the plot is titled Index Plot based on PC2. Since PC1 and PC2 weight the traits in genuinely different directions, as Figure 24 shows, the two rankings need not agree, and indeed the plot selects R1xC1 and R2xC1 while the table selects R1xC3 and R2xC1. Always confirm which component produced the ranking you are about to quote.
11 Interpretation
The Interpretation tab provides a plain-language summary of the analysis. After confirming that the analysis completed successfully, click Click here for interpretation (Figure 27). RAISINS summarises the design, significance level, treatment effects, and important interaction results.
For the working dataset it reports that no significant differences were found between row treatments or between column treatments for any character, so no pairwise comparison was performed for either, and that a significant interaction was observed for y3 (\(p = 0.05\)). It then explains what a significant interaction means, that the effect of the row treatments varies depending on the column treatment and the other way about, before reading the letter groupings: R2xC3 has the highest mean (\(1.70 \pm 0.37\)) and R2xC1 the lowest (\(1.08 \pm 0.20\)). It closes with a note on how to read the Cohen’s F column and the citations for RAISINS and for R itself. The text carries a Copy button and is written to be pasted almost directly into a results section.
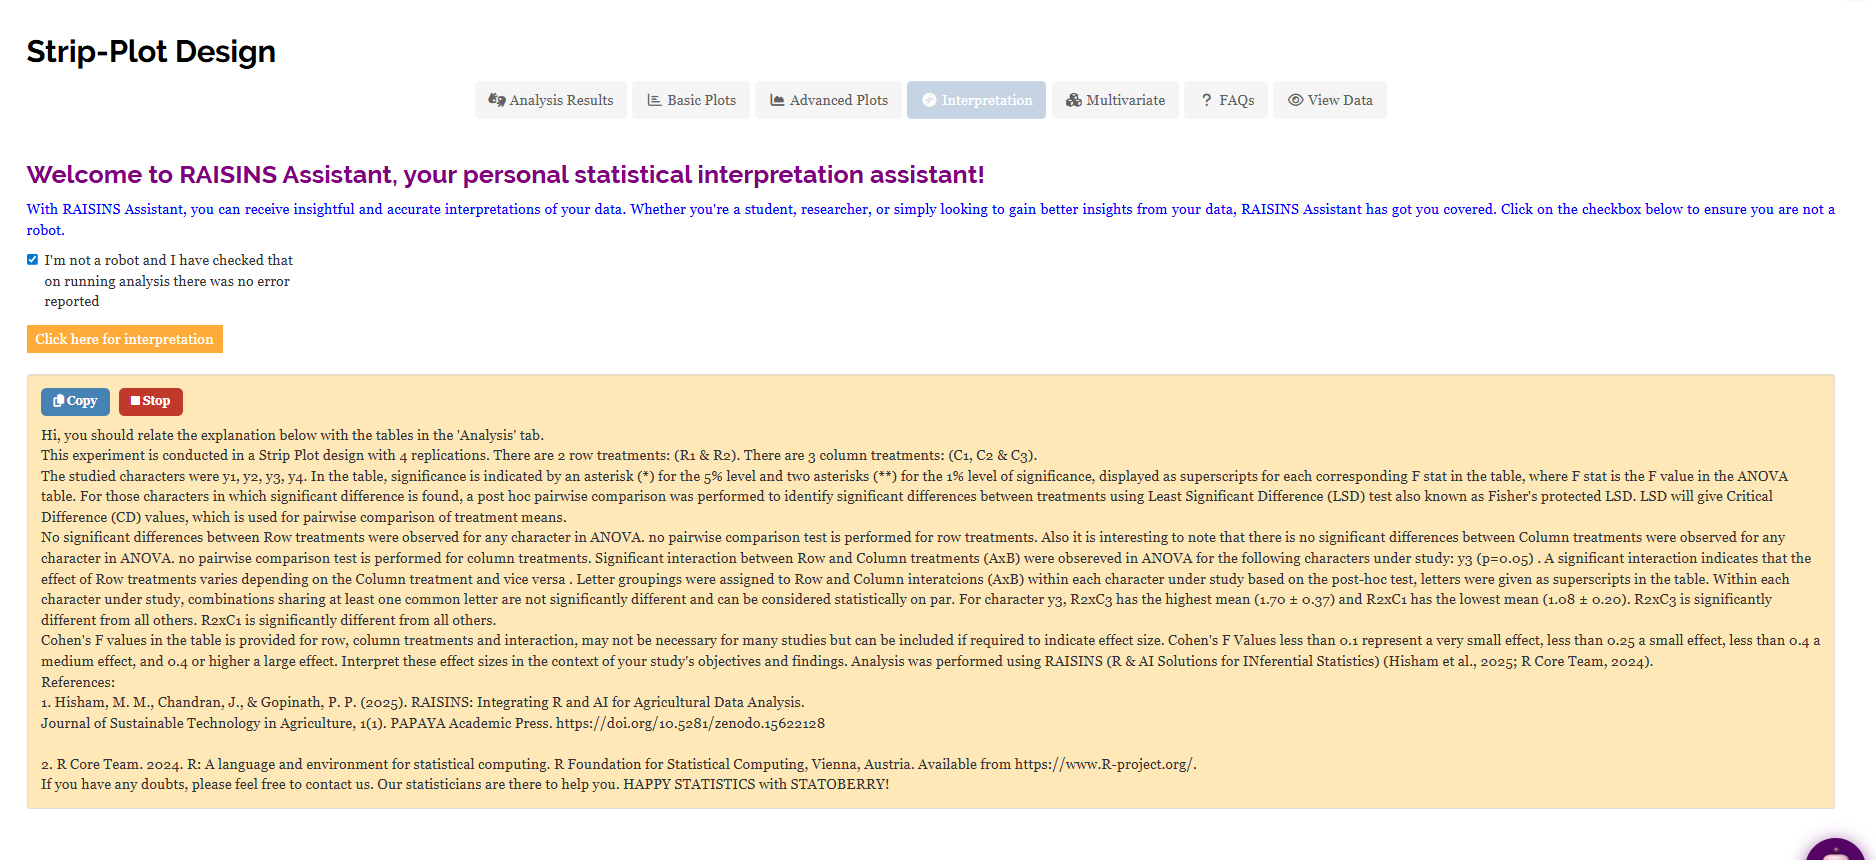
The interpretation is generated from the same computation as the tables, so use it as a guide, not a substitute. Read it with Figure 9 and Figure 12 open beside it. The numbers in the prose should match the numbers in the tables exactly, and where a sentence summarises the letter groupings, check it against the superscripts themselves, which are the authoritative record of which combinations could and could not be separated.
12 Chat with your data using RA-One
RA-One is the built-in assistant available in the strip-plot module. It allows users to ask questions about their analysis in plain language. The responses are based on the results generated by the module.
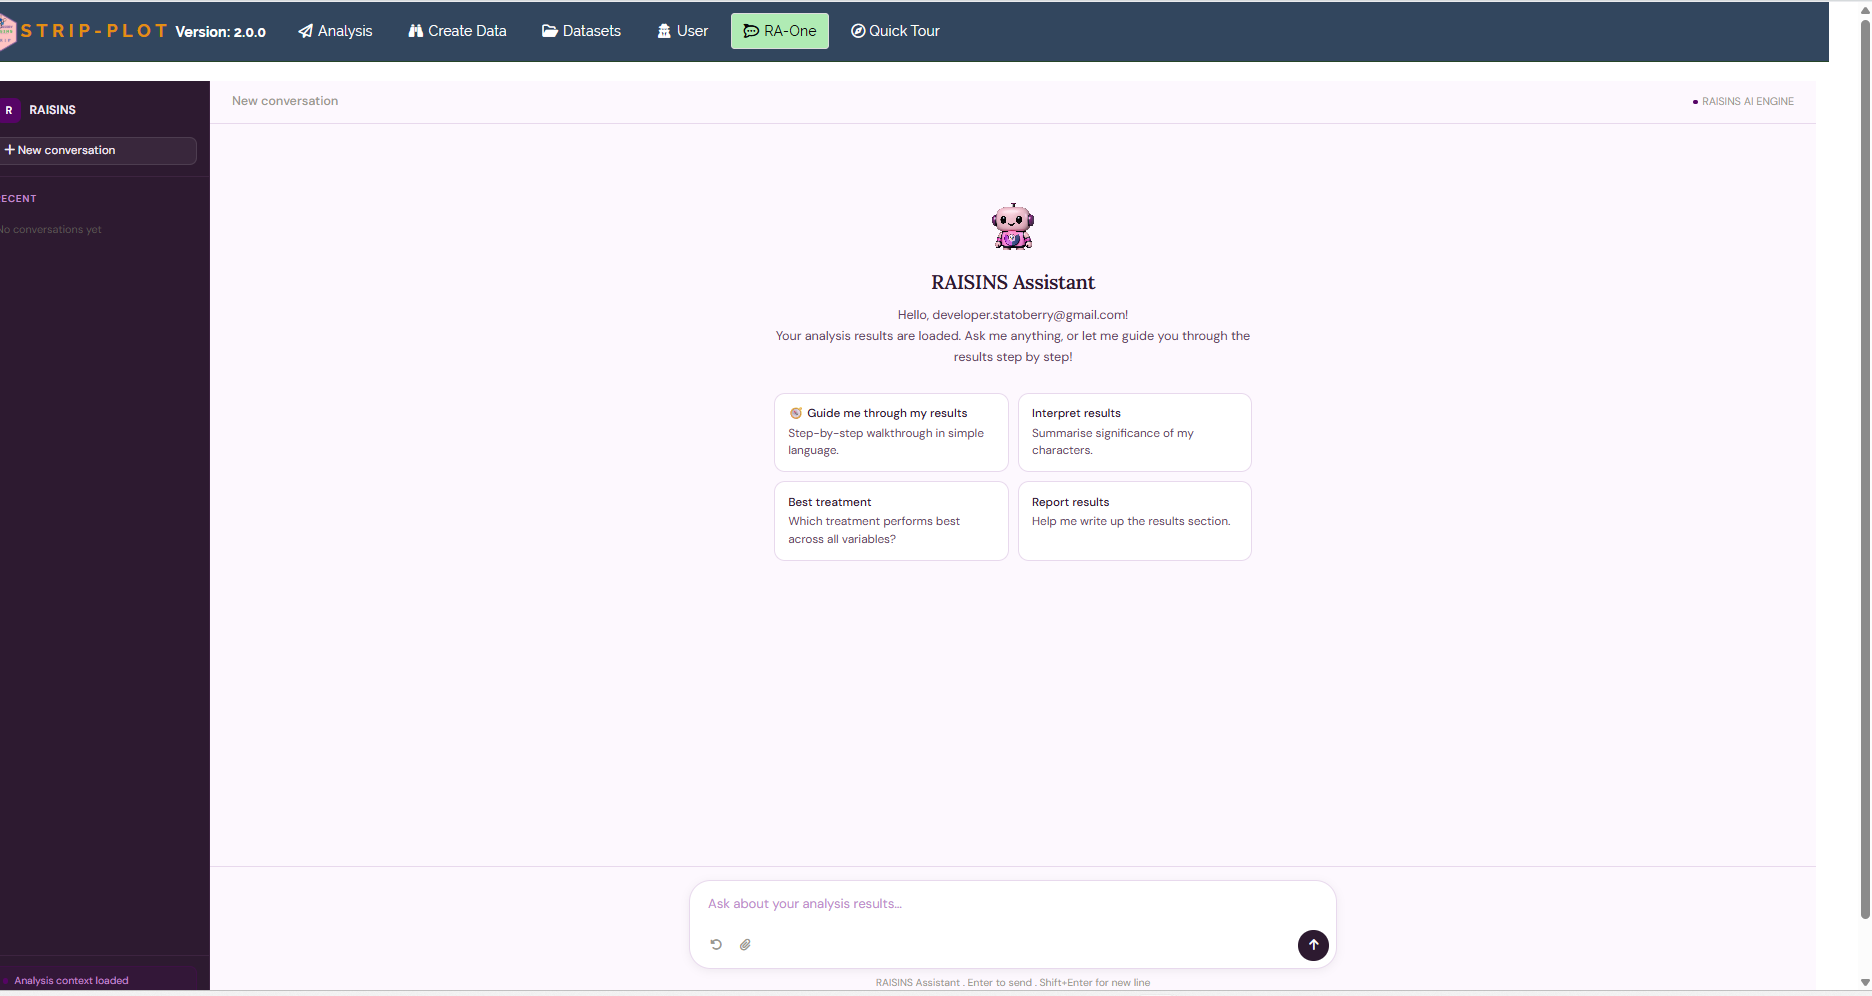
Once your results are loaded, RA-One greets you and offers four quick-start prompts (Figure 28): Guide me through my results for a step-by-step walkthrough in simple language, Interpret results to summarise the significance of each character, Best treatment to ask which combination performs best across all variables, and Report results to help draft the write-up. You can also type your own question, for example “is the interaction significant for any trait?” or “which column treatment gives the highest y3 under R2?”. A small status line in the bottom-left corner reads Analysis context loaded, confirming that the assistant is working from your results and not from generic knowledge.
Choosing Guide me through my results produces the walkthrough shown in Figure 29. RA-One opens by naming the design back to you, 2 levels of row treatment, 3 levels of column treatment and 4 blocks of replication, and identifies it as a Strip Plot Design, also known as a Split-Block Design. It then works through the response variables, noting that y1, y2 and y4 showed no significant source of variation while y3 carried a significant interaction, and it closes by offering follow-up questions: whether you would like to explore the PCA results further, see the interaction plots for y3, or discuss how to report the findings in a paper. The Report results prompt is particularly useful for a strip plot, because the reporting conventions are less familiar than those of a one-way ANOVA and the three error terms have to be stated explicitly for a reader to reconstruct the tests.

RA-One is grounded in your analysis, but it is still a language model summarising a set of tables, and a summary can misplace a value. Treat Figure 9, Figure 10, Figure 11 and Figure 12 as the record of what was computed. If a sentence in the chat names a highest mean, a p value or a treatment combination that you intend to publish, confirm it against the corresponding cell before you write it down. The assistant is excellent at explaining what a result means; the tables remain the authority on what the result is.
The same chat window can also prepare your data. It can build a correctly formatted design template (Section 6.4) for you to fill in, checking the error degrees of freedom as it goes and raising the replication count if the design is too thin, or fetch a model dataset (Section 6.3) so you can try the module straight away, so you never need to leave the tab to get a file ready.
Within a single conversation, RA-One can interpret your results, build a data template, fetch a model dataset, and help you draft the write-up, so most of a routine strip-plot session can be conducted without ever leaving the chat window.
13 FAQs
The FAQs tab addresses common questions about the strip-plot design and its analysis. It includes explanations of when a strip-plot design is appropriate and why three error terms are required.
14 View data
View Data is the primary diagnostic tool for ensuring data integrity before analysis, and it is the tab shown in Figure 3. When you upload your dataset, RAISINS runs an automated Health Check and prints its instructions above the table. The rule is simple to apply by eye: the treatment columns should be highlighted in yellow or green, and all numerical values should appear in green. If both conditions are met, your file is in good health. Where a column that ought to be numeric appears in yellow instead, there is something wrong with the numbers in it, most often a space between digits or an incorrect decimal point, and the instructions tell you to review that column and correct it.
In Figure 3 the two treatment columns are yellow and the Replication and response columns are green, which is exactly the pattern to look for. For a strip plot the check that matters most beyond the colours is the property that defines the design: that every row treatment meets every column treatment exactly once inside every replication. Reading down the table, replication 1 contains the six lines R1C1, R1C2, R1C3, R2C1, R2C2 and R2C3, and replication 2 begins the same six over again. If an intersection were missing from one replication, or if a treatment label were spelled two different ways, the crossing would break, the three error terms could no longer be cleanly separated, and the critical differences of Section 8.1 would stop being exact. Fix anything flagged here before trusting the results, and cross-check the Missing column of the Summary Plot in Section 9, which should read 0.00 throughout.
15 Wrapping up
A strip-plot design is used when both treatment factors must be applied to large experimental units. The two factors are assigned to perpendicular strips, and their intersections form the treatment combinations. This structure produces three error terms, which are used to test the row factor, column factor, and interaction separately.
In the working example, the row and column main effects were not significant. The A × B interaction was significant for y3, indicating that the effect of one factor depends on the level of the other factor.
The choice of design should be based on how the treatments can be applied in practice. A factorial CRD or RBD is preferable when both factors can be independently randomised to small plots. A split-plot design is more appropriate when only one factor requires large experimental units.
A strip-plot design exists because of a practical constraint, that neither factor can be randomised over small plots, and everything distinctive about its analysis follows from how that constraint is handled. Laying the two factors in perpendicular strips creates three kinds of experimental unit: horizontal strips, vertical strips, and the intersections where they cross. Three kinds of unit create three error terms, and three error terms create three critical differences, CD (A) for comparing row treatments, CD (B) for comparing column treatments and CD (AxB) for comparing intersections. Read the ANOVA table as three storeys, check which error each F-test used, and quote the critical difference that matches the comparison you are actually making. That single habit is the difference between reporting a strip plot correctly and reporting it plausibly.
The main effects were not significant in the working example, whereas the interaction for y3 was significant. This illustrates the importance of using the appropriate error term for each effect. The number of replications also affects the precision of the main-effect tests and should therefore be considered carefully when planning a strip-plot experiment.
If your units are homogeneous and both factors can be randomised freely over small plots, use the two-factor factorial CRD module; if the units fall into natural blocks but both factors are still freely randomisable, use the two-factor factorial RBD module; and if only one of the two factors is constrained to large units, the split-plot module is the right design and will give you a far better test of your subplot factor than a strip plot will give you of either. And if you get stuck at any point, RA-One is available 24 x 7, or write to us at [email protected].
