RAISINS learning hub
your comprehensive space for mastering data analysis with RAISINS-interactive guides, real examples, and clear, step-by-step guidance that make statistics simpler and more accessible.
- step-by-step
- interactive
- smooth reading
- statistics, sweeter

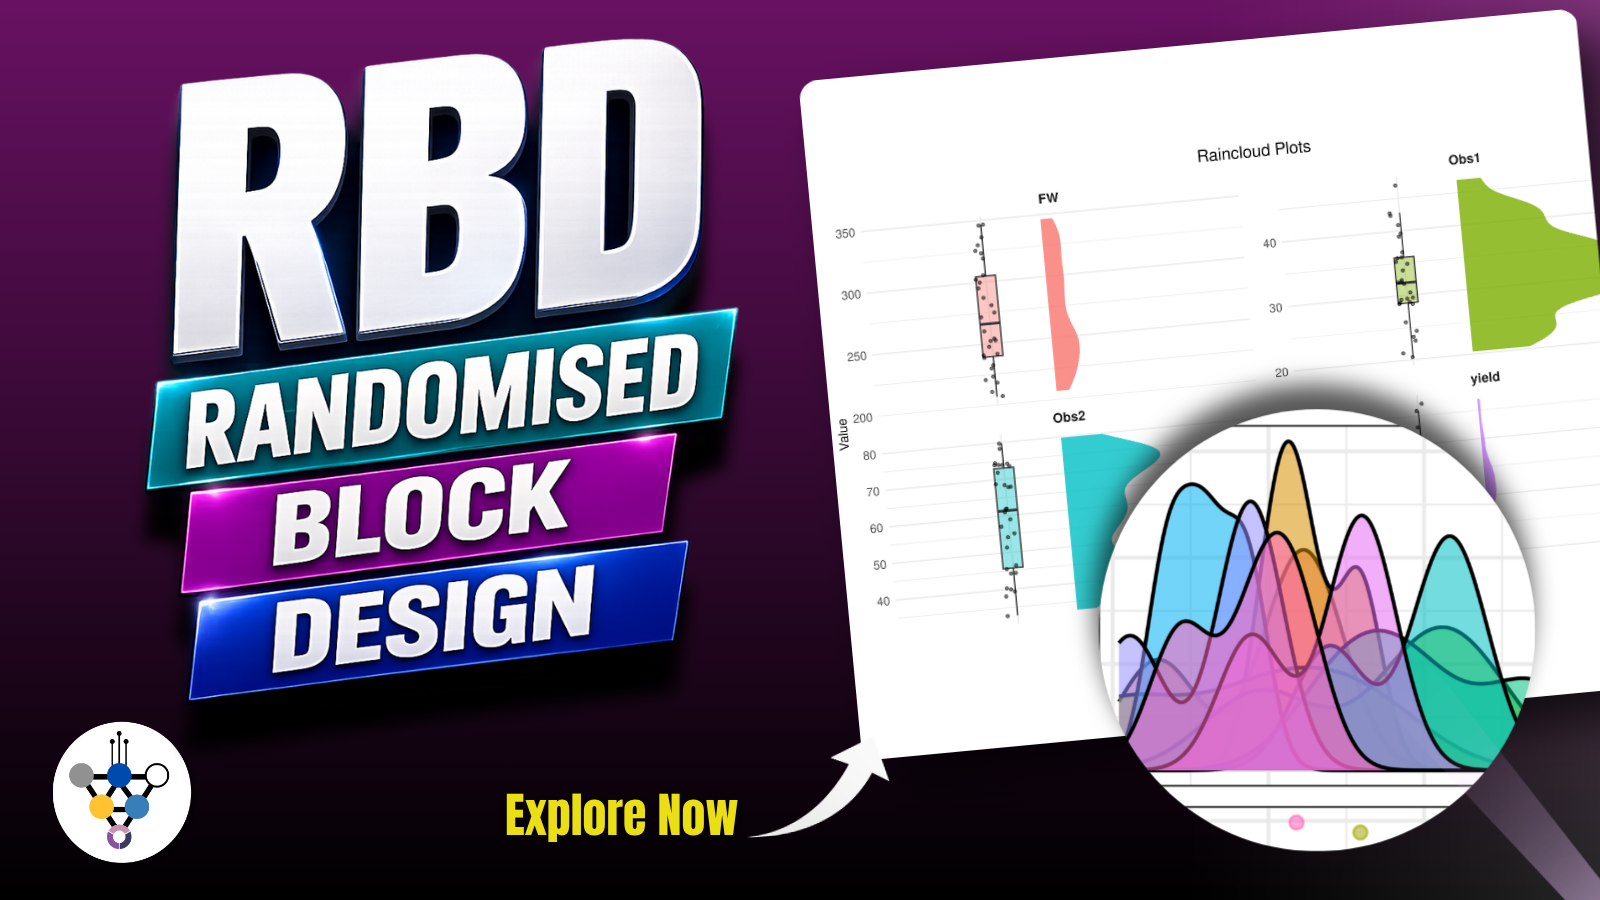
Randomized Block Design
A Randomized Block Design removes the variation caused by non-uniform field conditions, different days, or different batches by grouping similar experimental units into blocks. This tutorial explains what blocking buys you, how to read the RBD ANOVA table, when grouping letters appear, and how to run the whole analysis code-free in RAISINS… Read more …
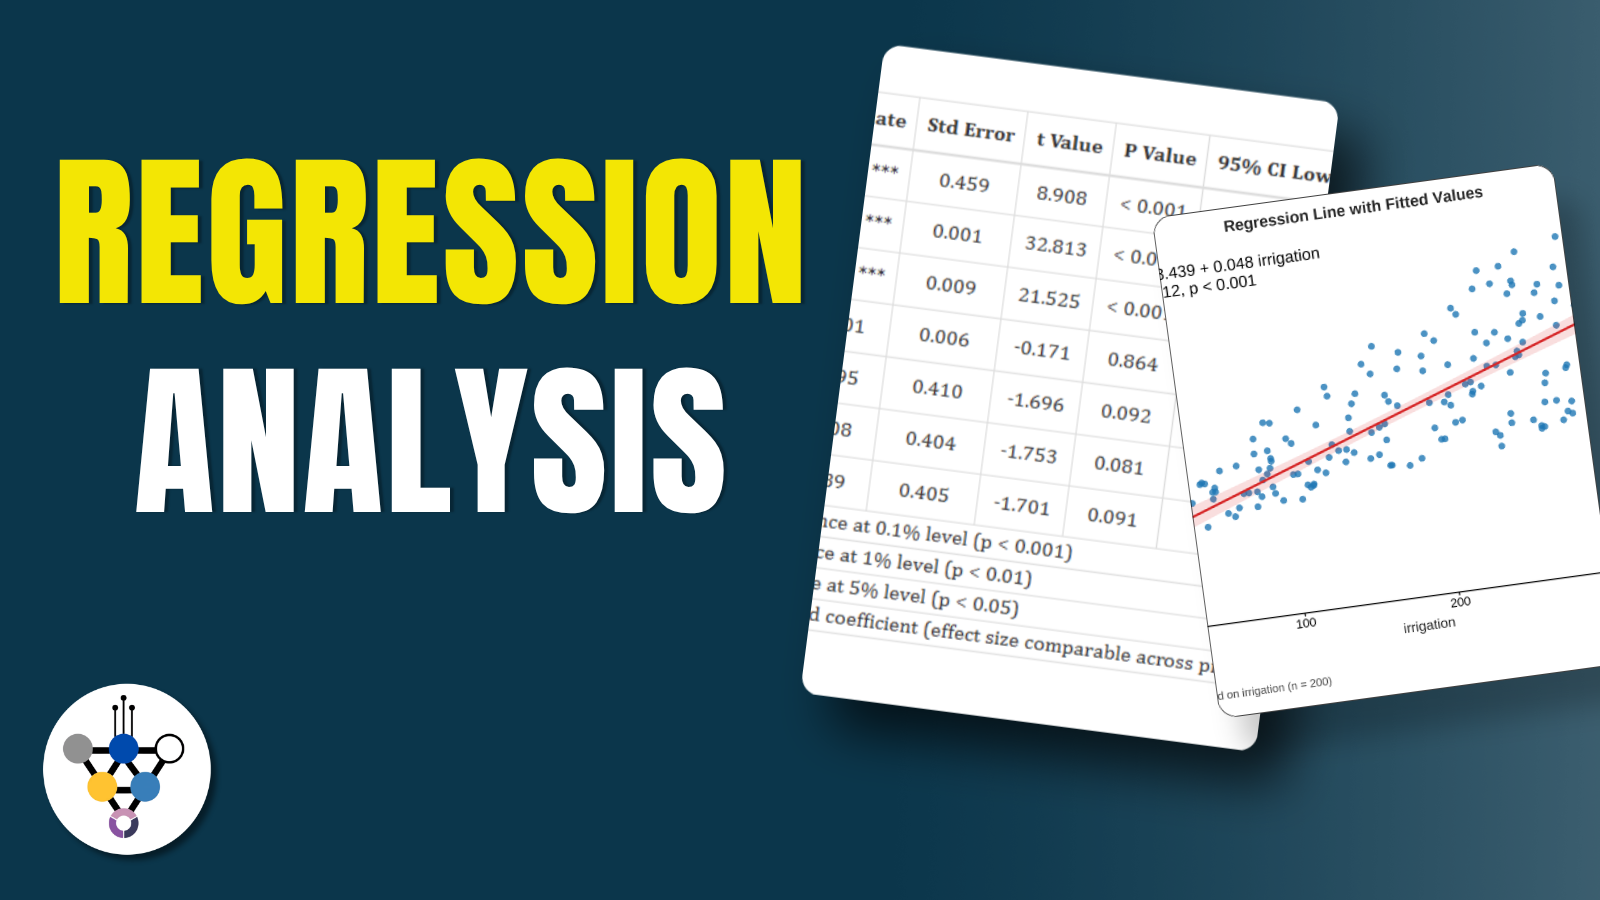
Regression Analysis
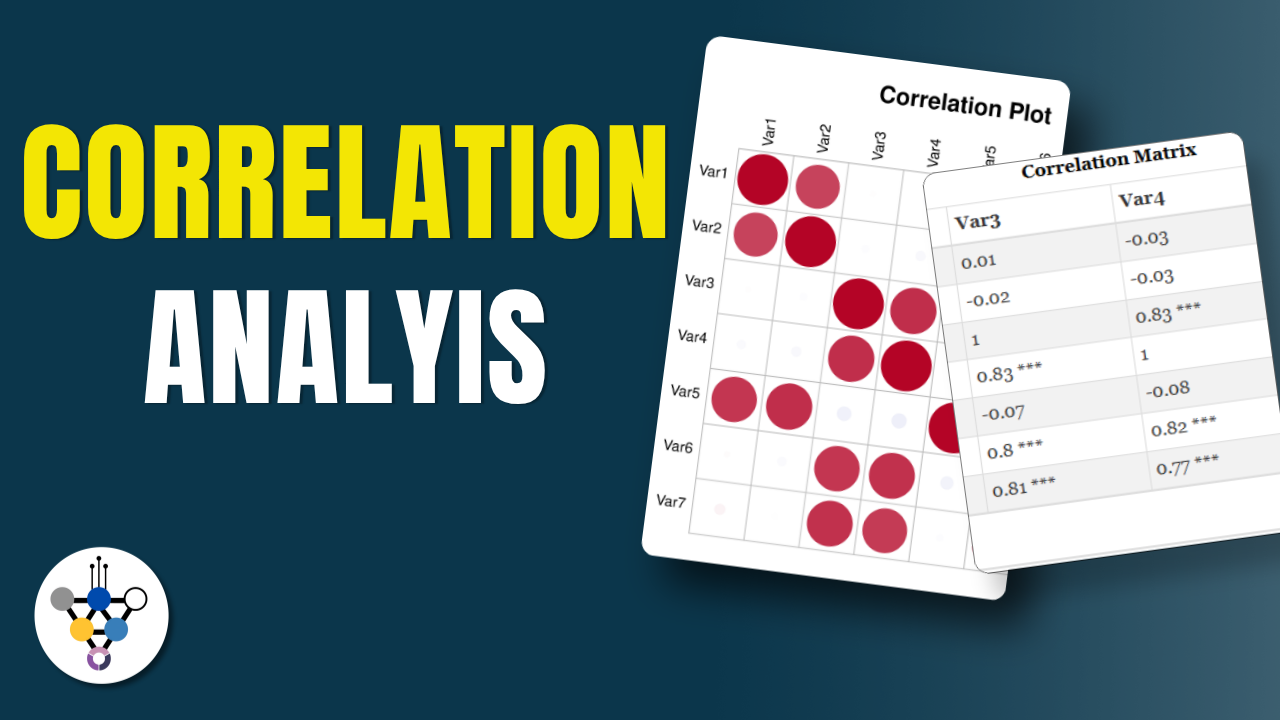
Correlation Analysis
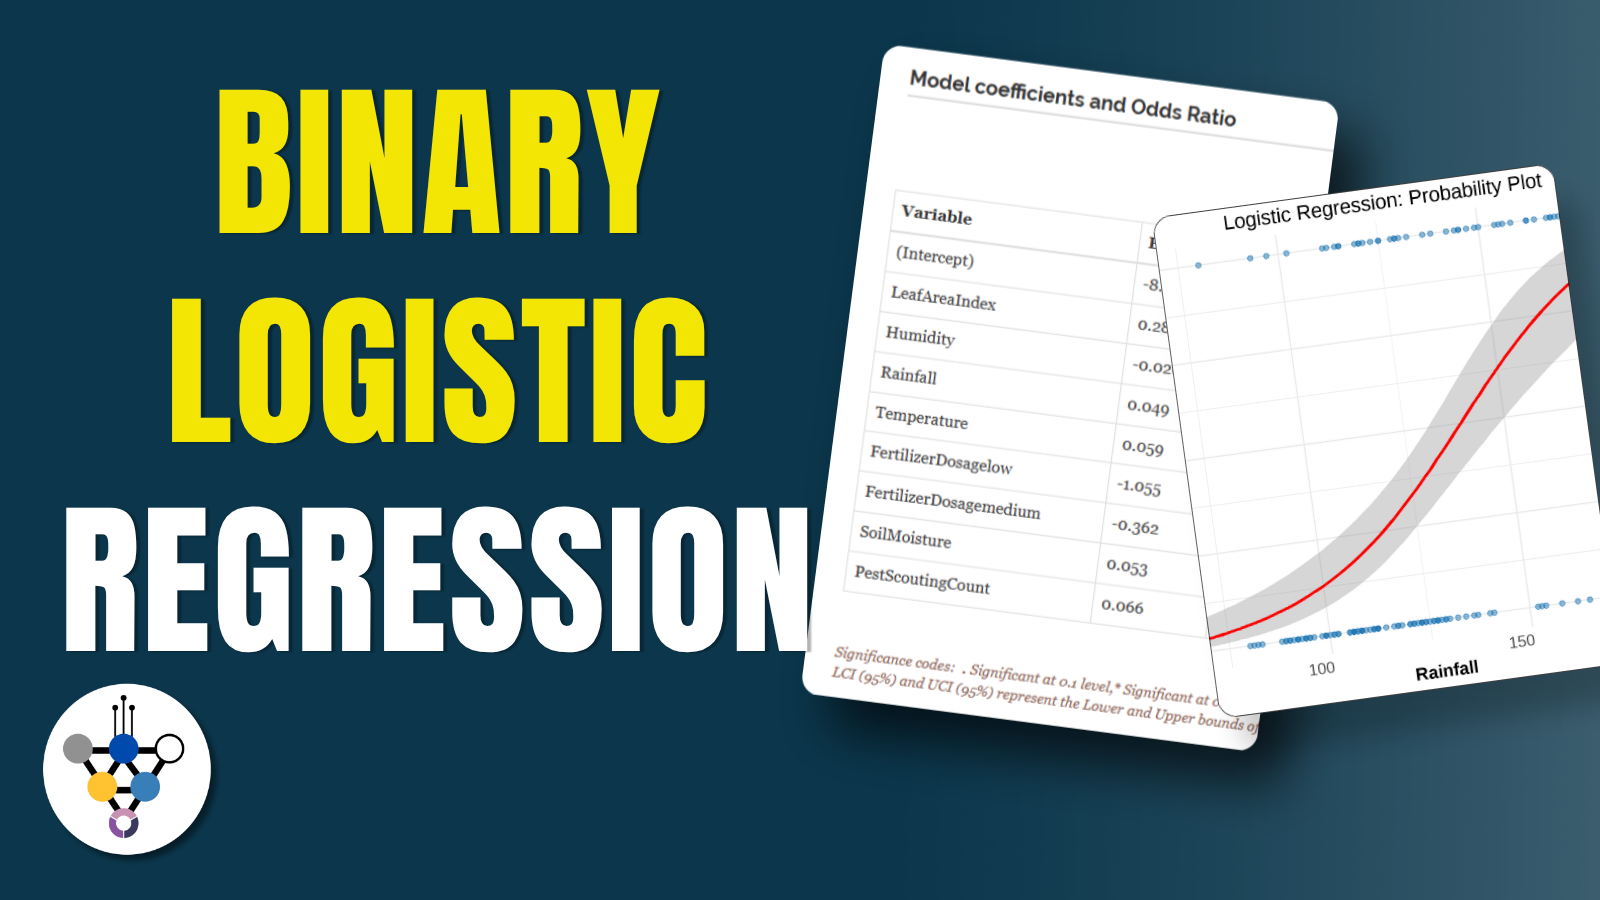
Binary Logistic Regression
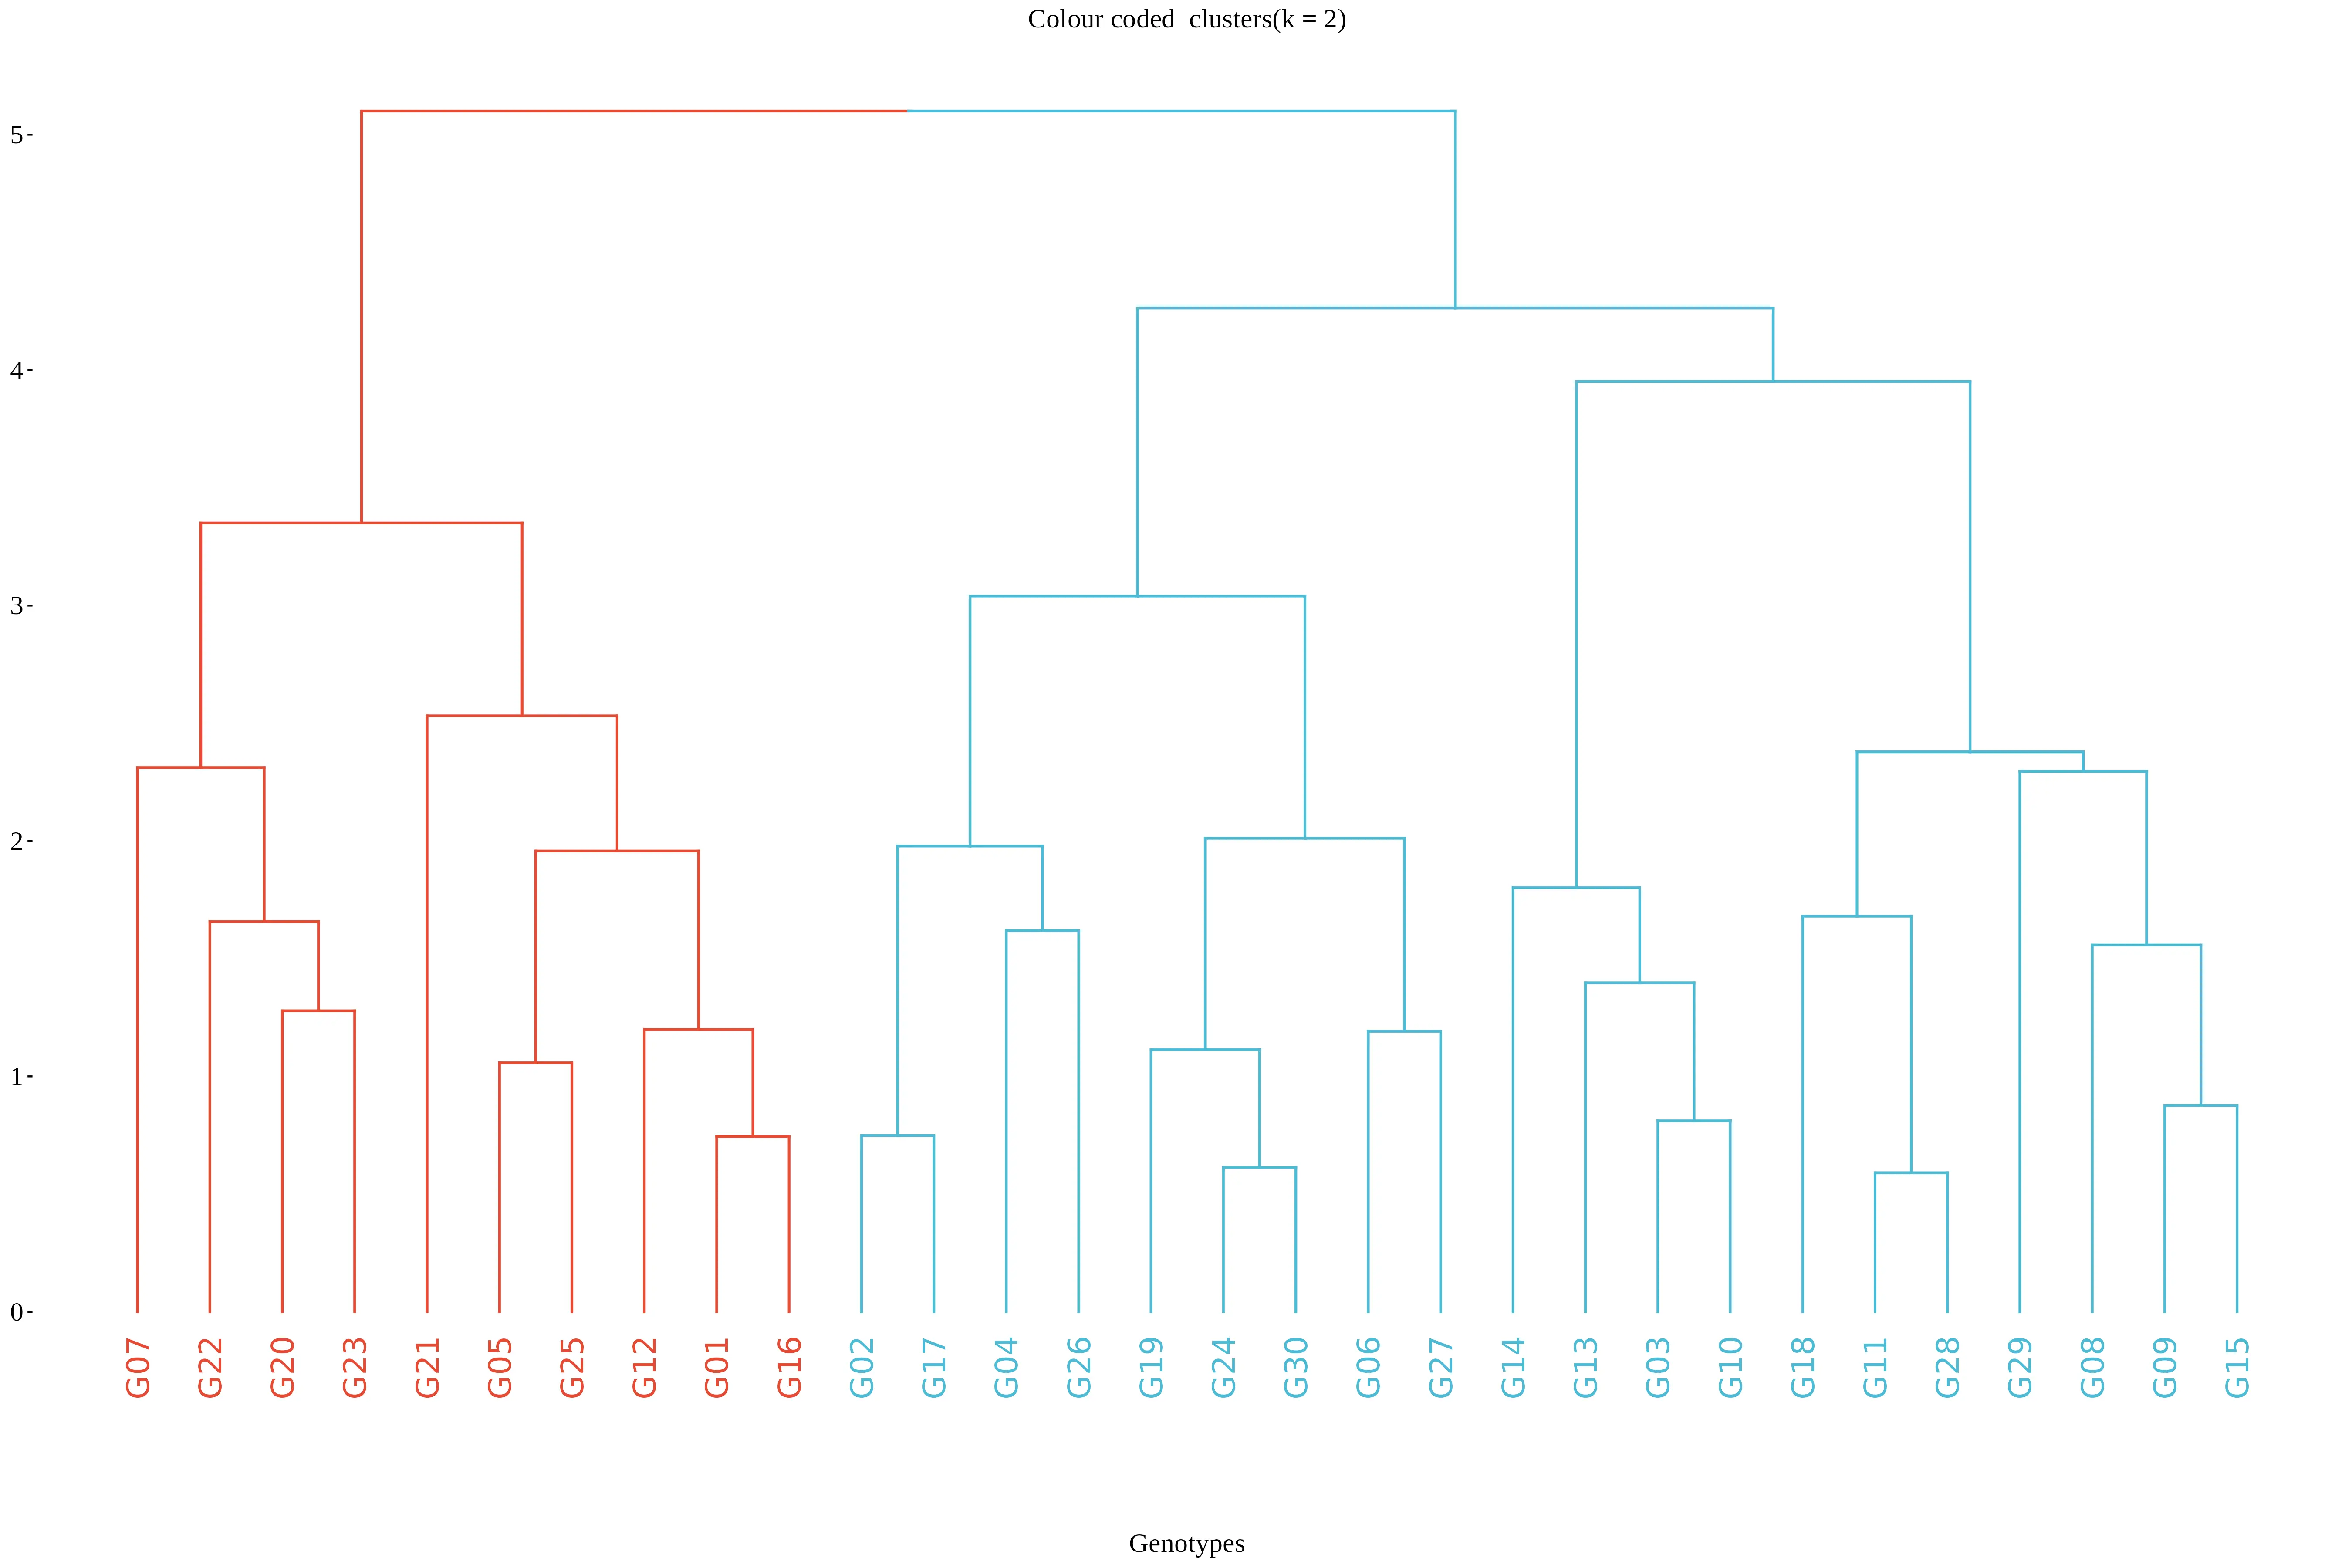
Hierarchical Cluster Analysis
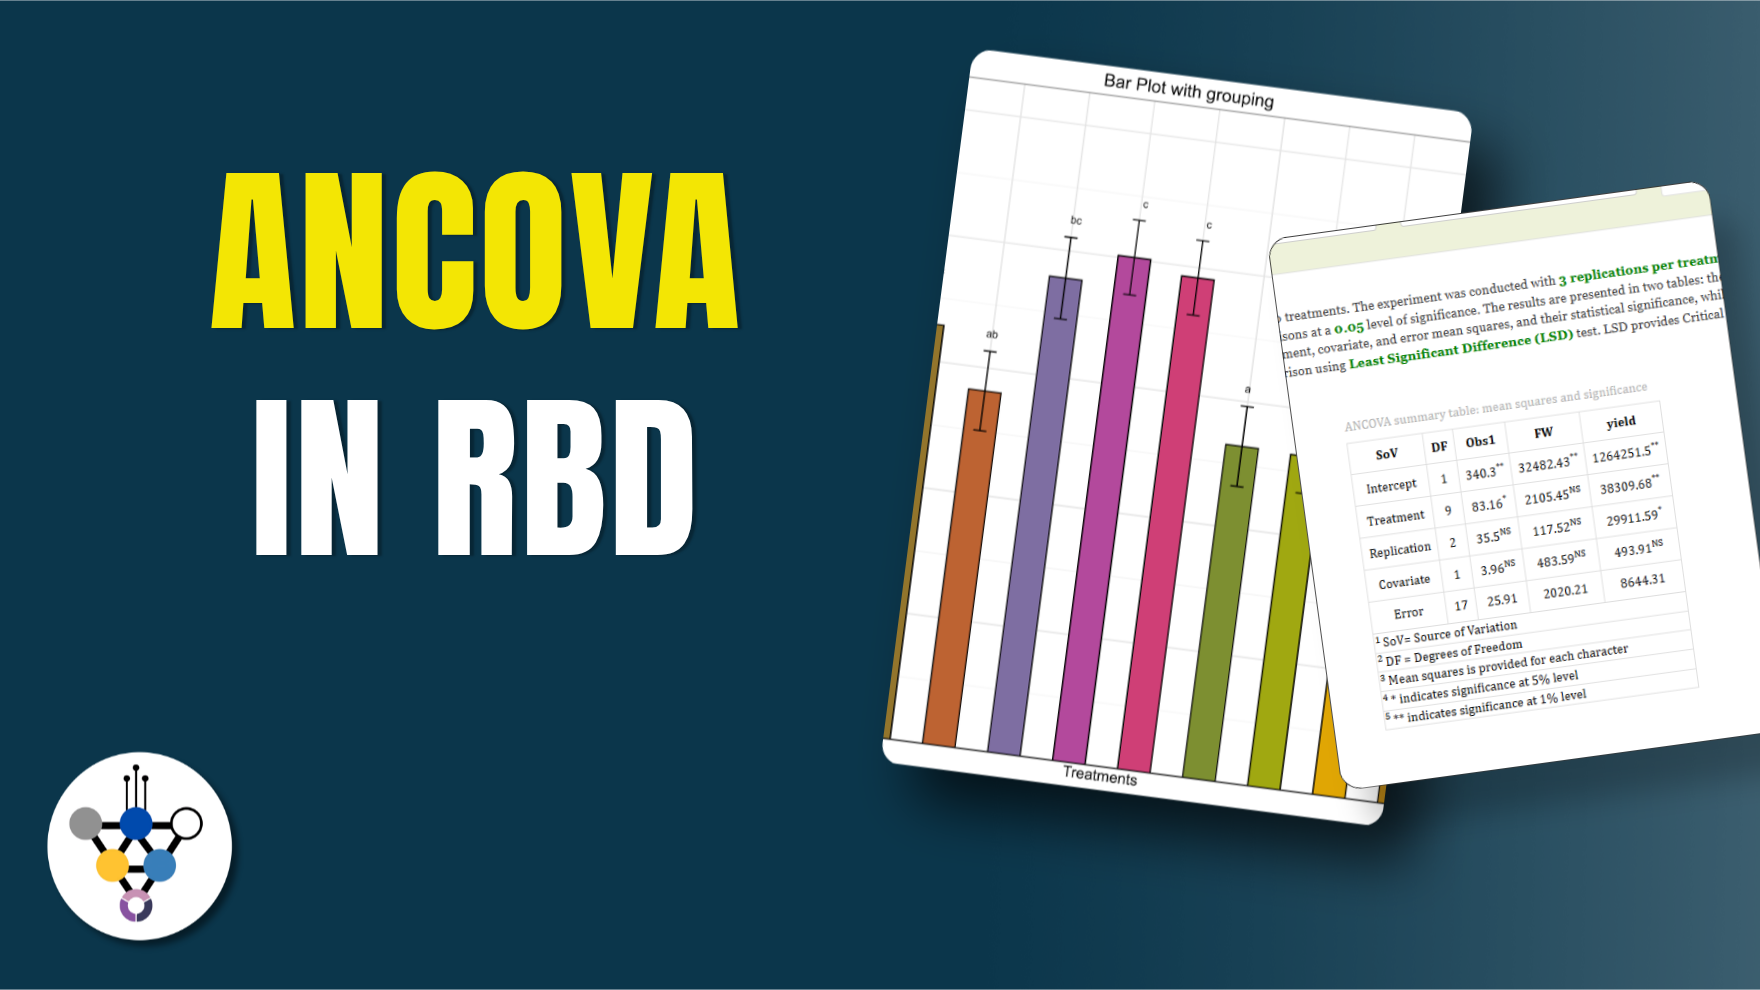
Two-Way ANCOVA (RBD)
Description: This tutorial provides a comprehensive guide to understanding and conducting a two-way Analysis of Covariance (ANCOVA) within a Randomized Block Design (RBD). We detail the mathematical formulation, underlying statistical assumptions, and practical steps for interpreting estimated marginal means and model diagnostics in RAISINS. Read more …
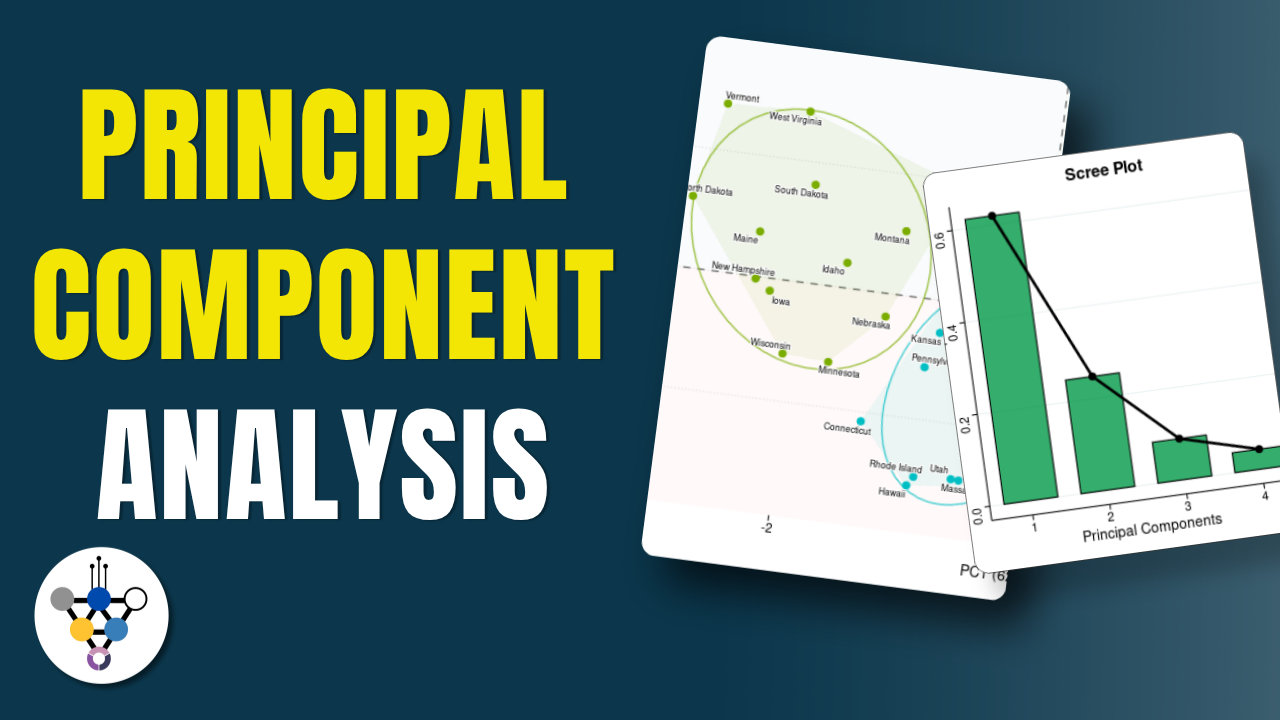

Probit Dose/Time Response Analysis
Probit analysis models the probability of a response as a function of dose, concentration or time, and estimates effective doses such as LD50 and LC90. This tutorial explains the probit link, how RAISINS reports effective doses and fit, which goodness-of-fit statistics are valid for which data, and how to run the whole analysis code-free… Read more …
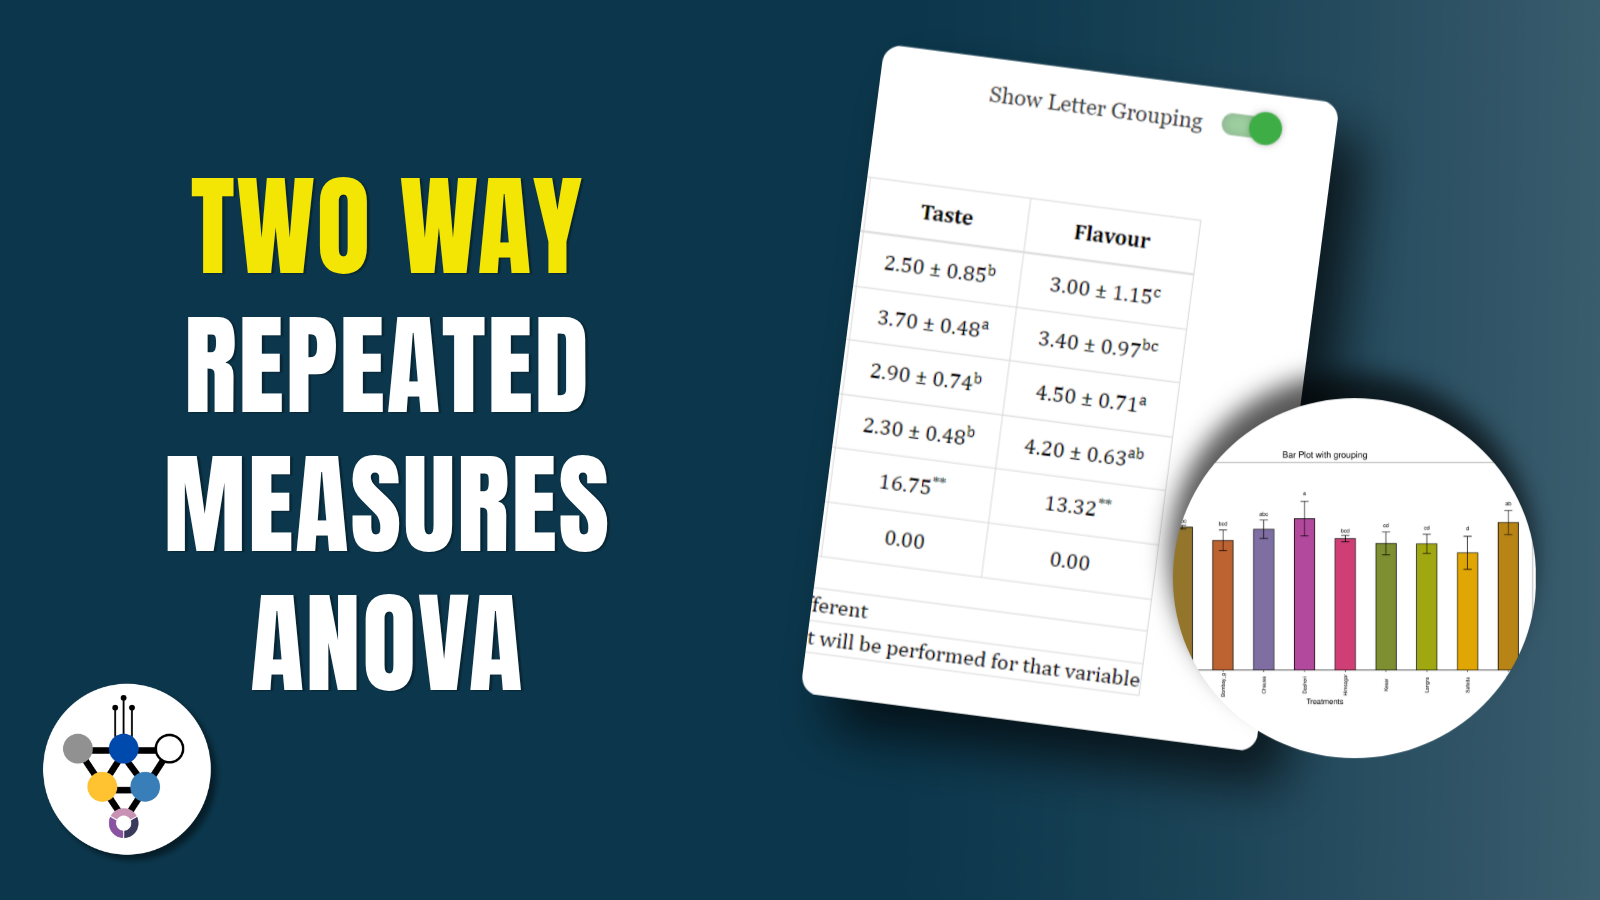
Repeated Measures Two-way ANOVA
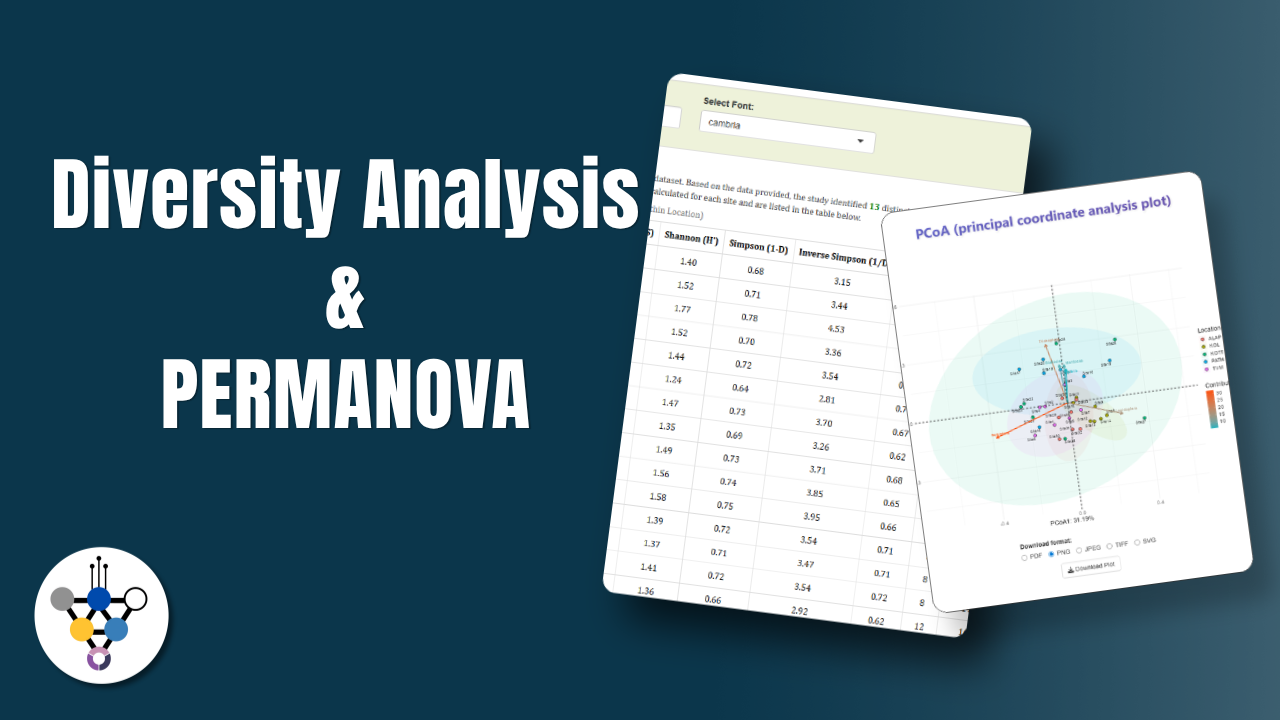
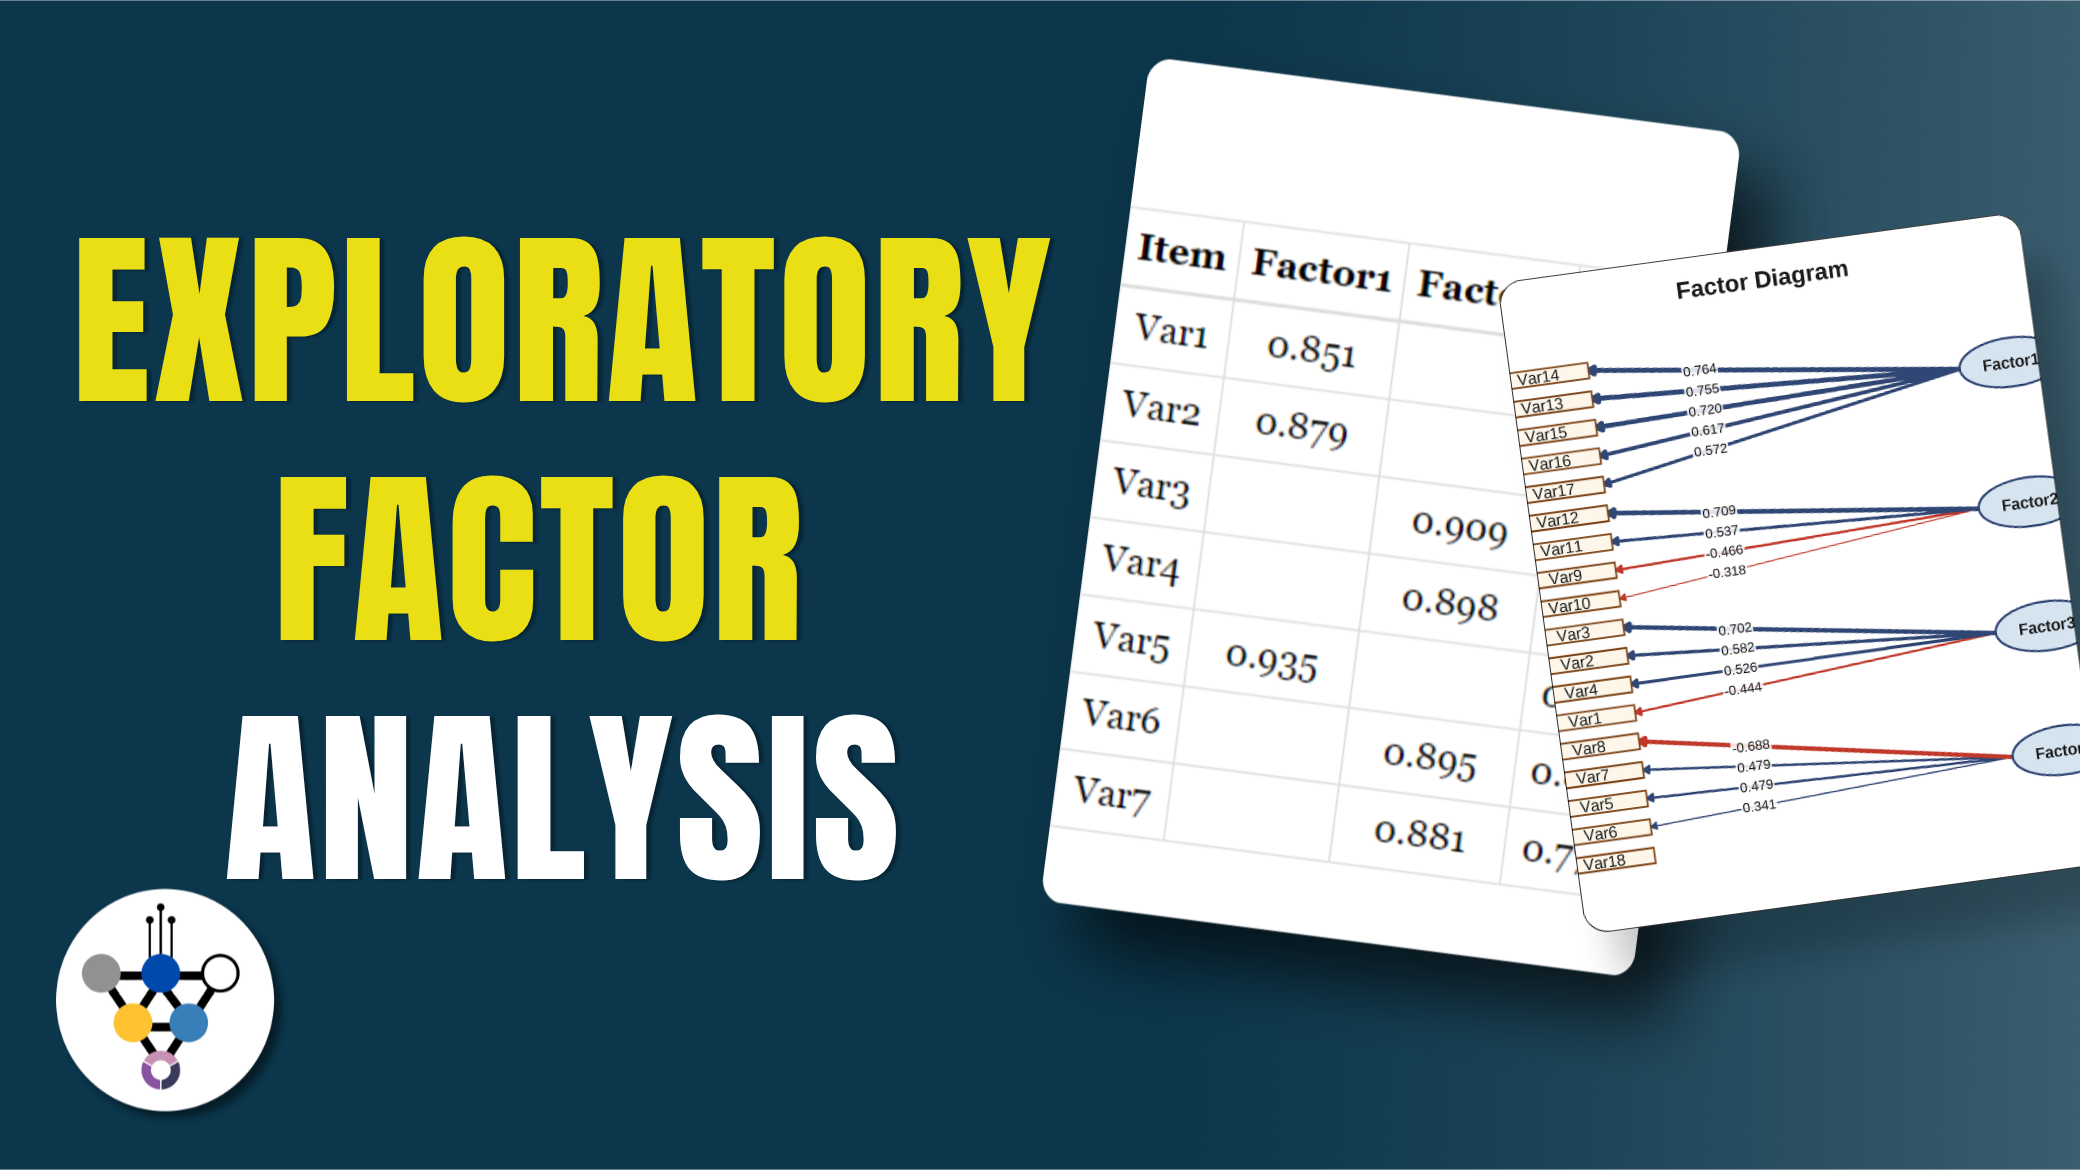
Exploratory Factor Analysis (EFA)
K-Means Cluster Analysis
Two-Factor Factorial CRD
Two-Factor Factorial RBD
Split-Plot Design
A split-plot design handles two factors when one of them must be applied to large units, splitting the experiment into a whole plot stratum and a subplot stratum with an error term for each. This tutorial explains where the design comes from, why it needs two critical differences, and how to run the whole analysis in RAISINS… Read more …
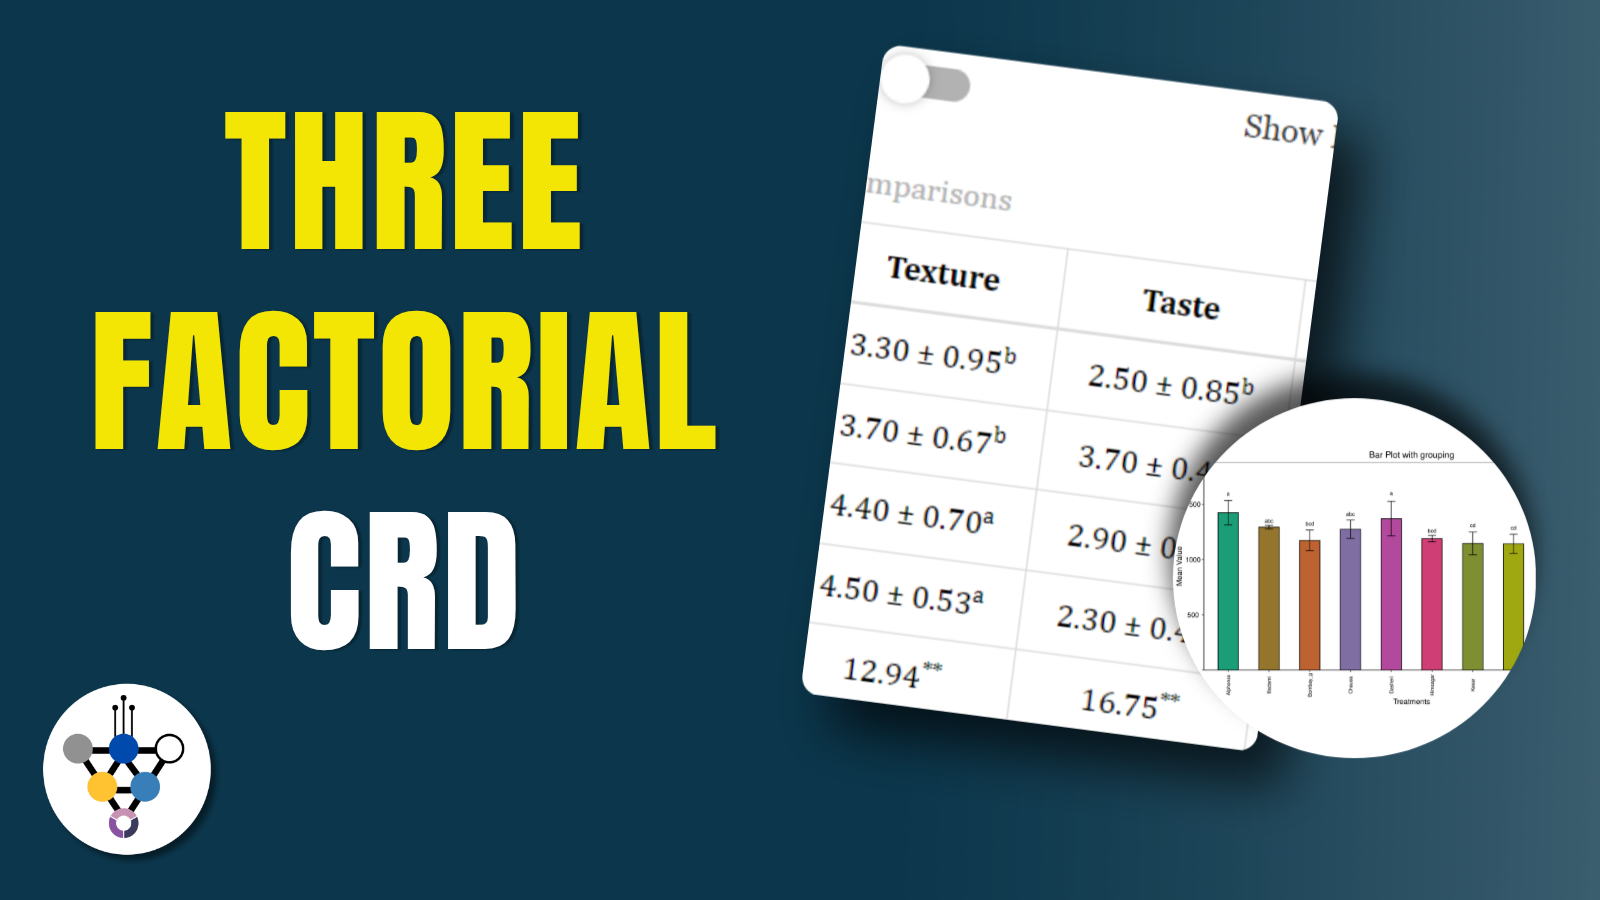
Three-Factor Factorial CRD
A three-factor factorial CRD tests three factors, their three two-way interactions and their three-way interaction in one experiment, under complete randomization and without requiring equal replication. This tutorial explains the design, how to size it, and how to run and read the whole analysis in RAISINS… Read more …
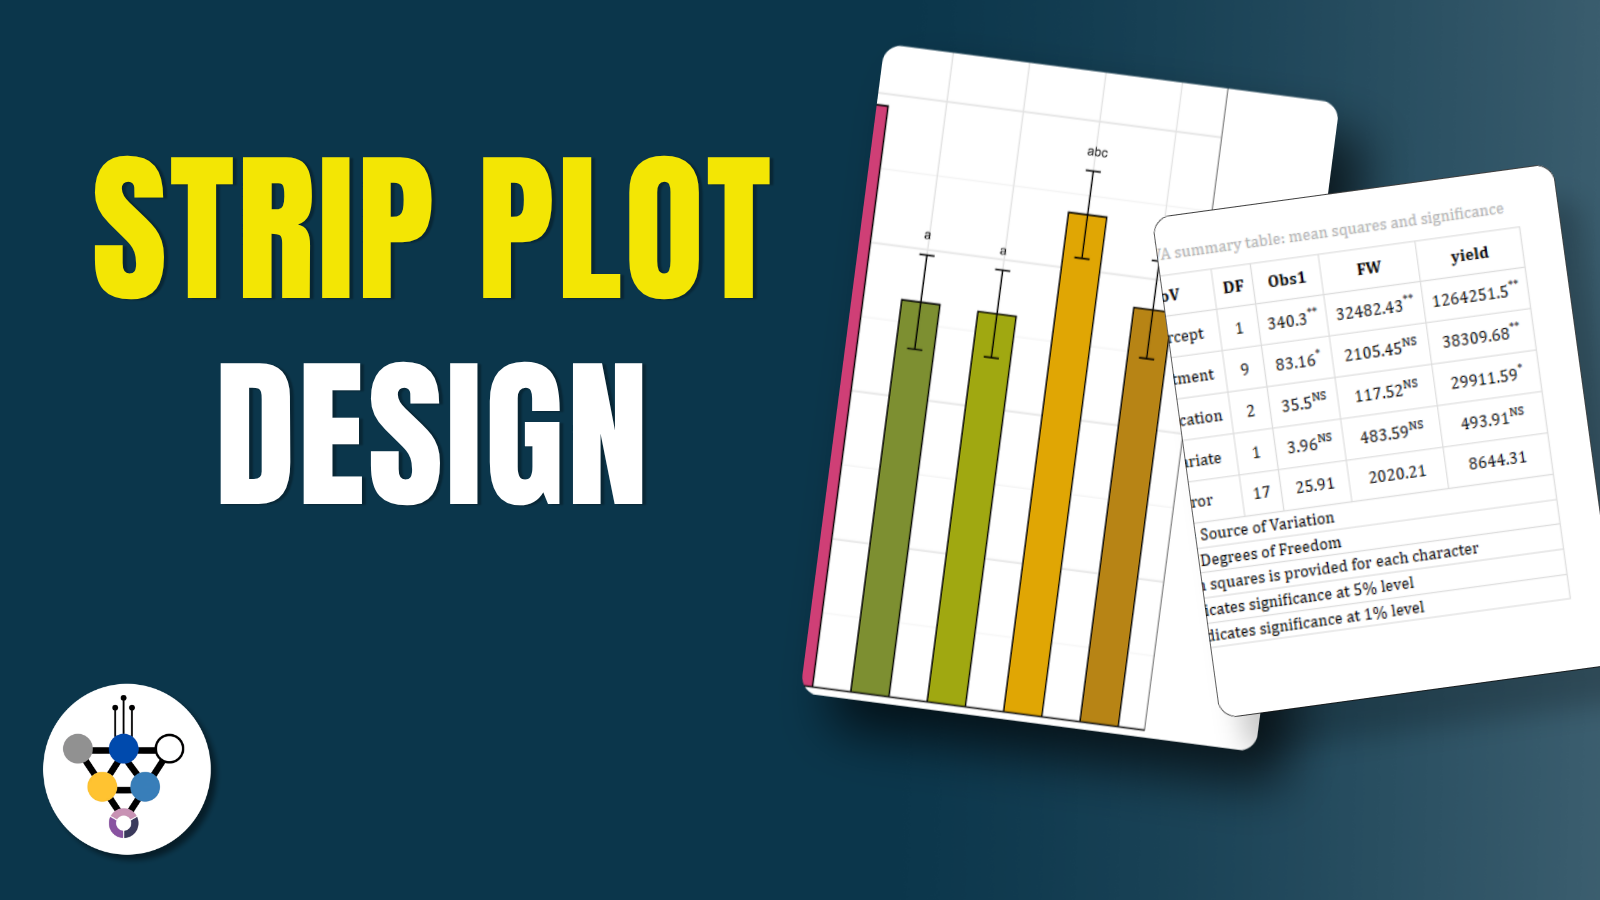
Strip-Plot Design
A strip-plot design applies two factors in perpendicular strips across each block, so that both factors occupy large units and their combinations arise at the intersections. This tutorial explains where the design comes from, why it carries three separate error terms, and how to run the whole analysis in RAISINS… Read more …
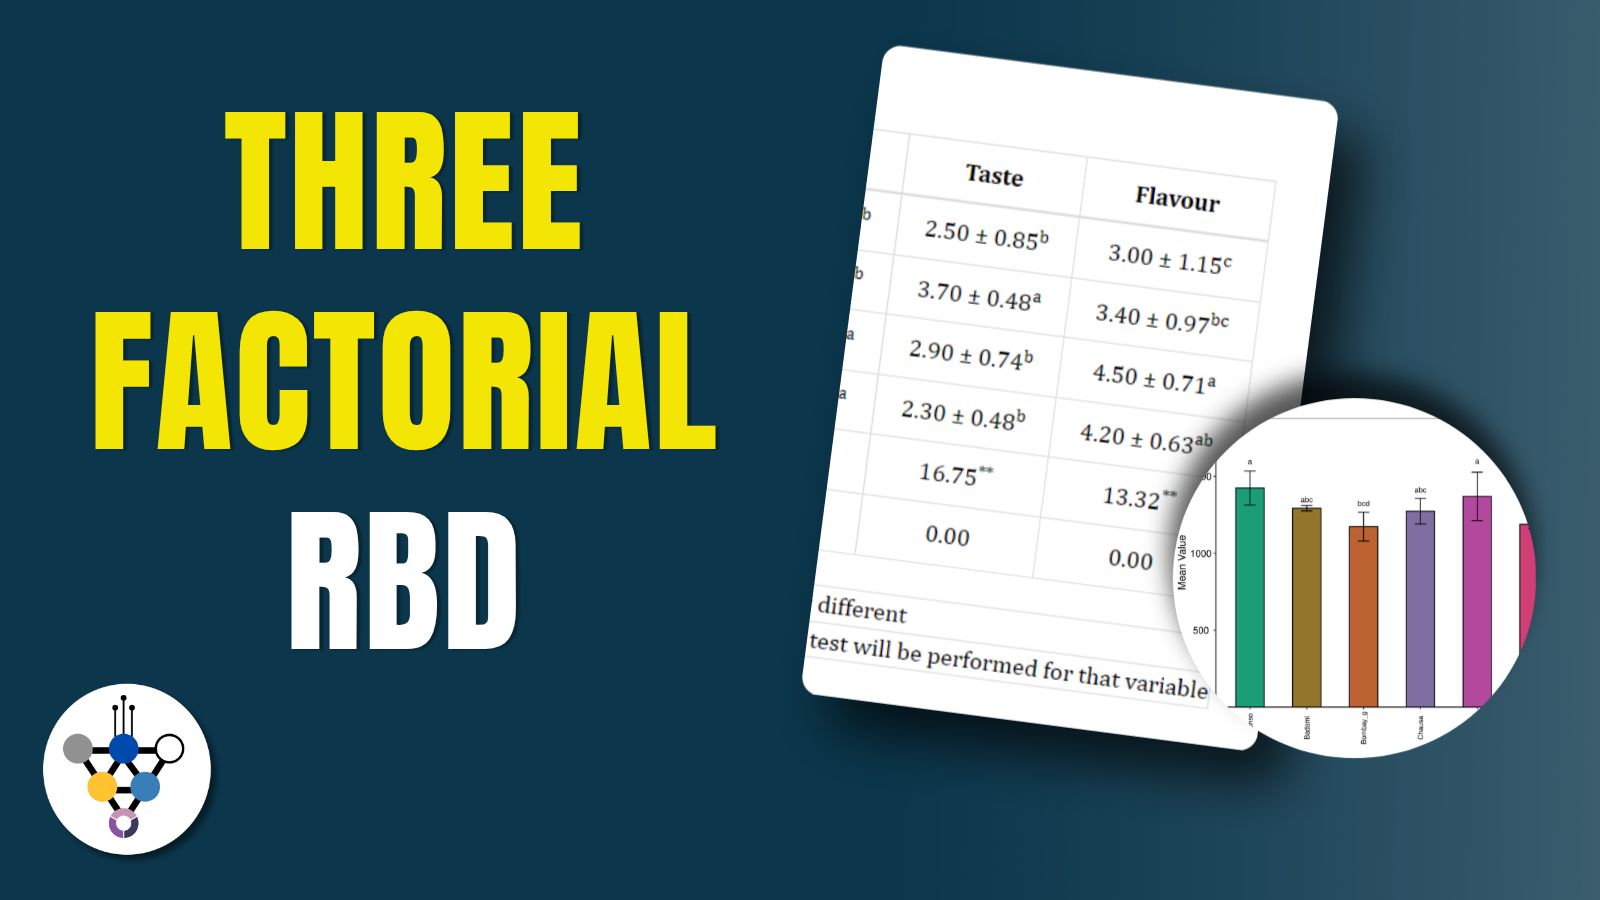
Three-Factor Factorial RBD
A three-factor factorial RBD tests three factors, their three two-way interactions and their three-way interaction in one blocked experiment, so that field or bench variation is removed from the error term. This tutorial explains the design, how to size it, and how to run and read the whole analysis in RAISINS… Read more …
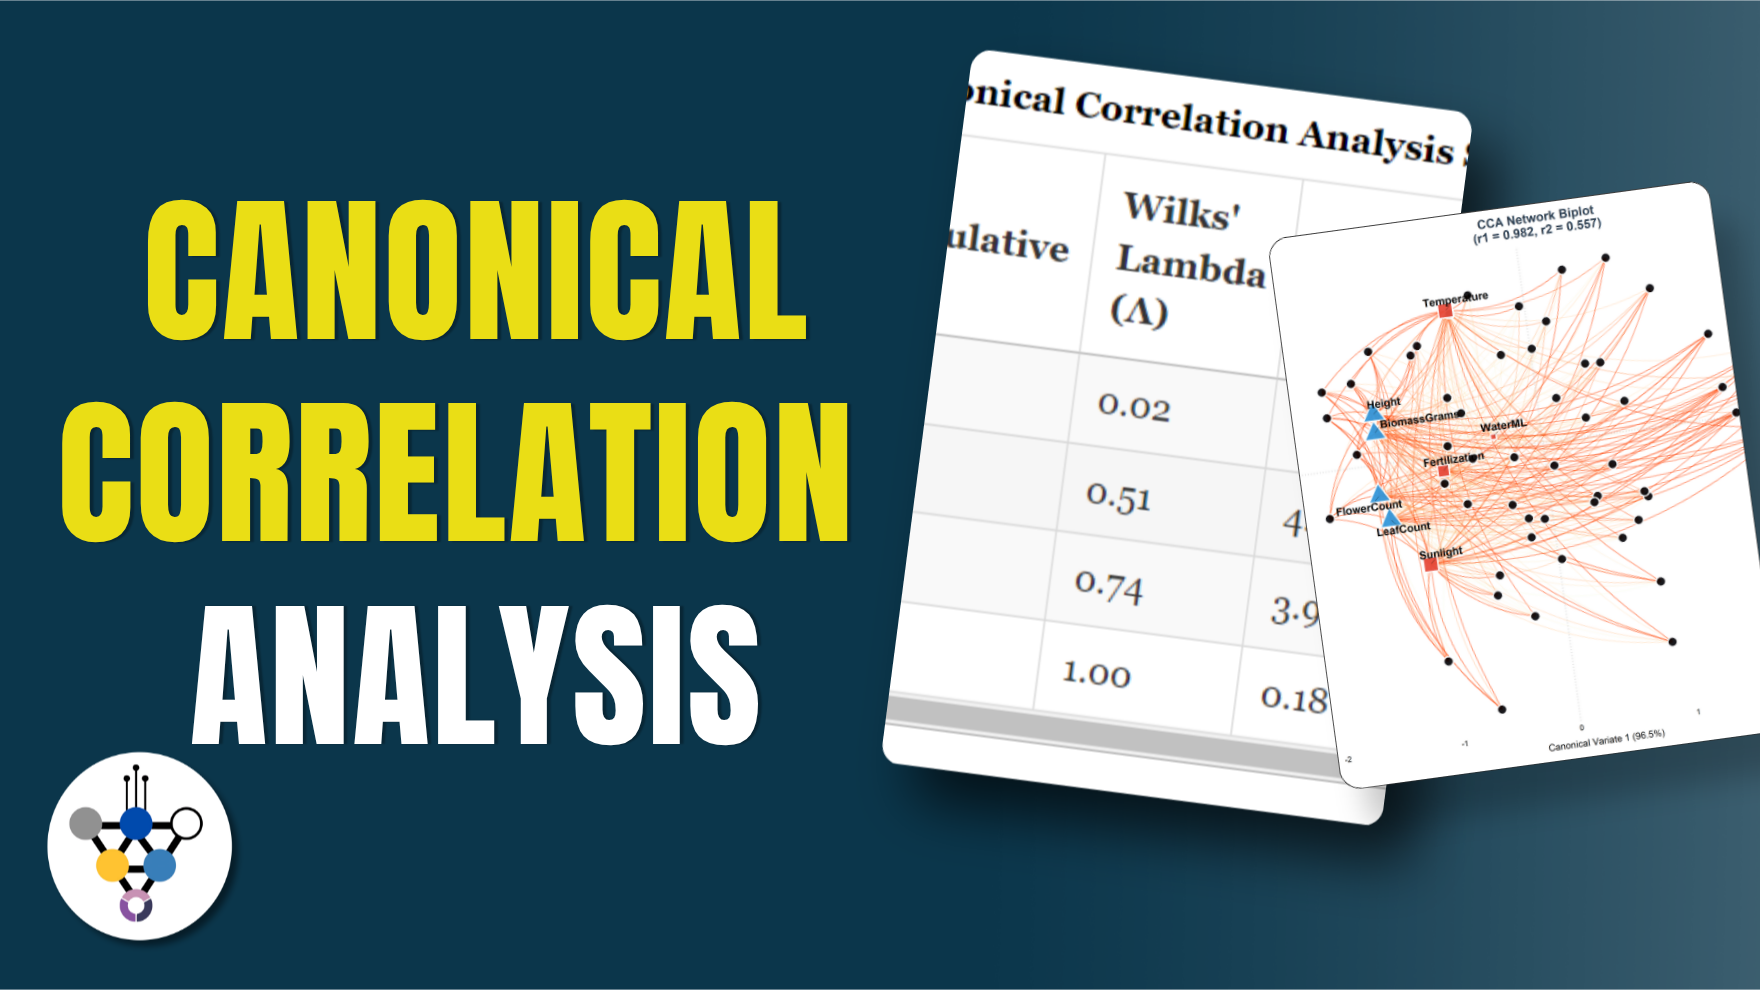
Canonical Correlation Analysis
Canonical correlation analysis finds the strongest linear relationship between two whole sets of variables at once. This tutorial explains what a canonical variate and a canonical correlation are, how RAISINS decides which functions are worth interpreting, how to read the loading tables, and how to run the whole analysis code-free… Read more …
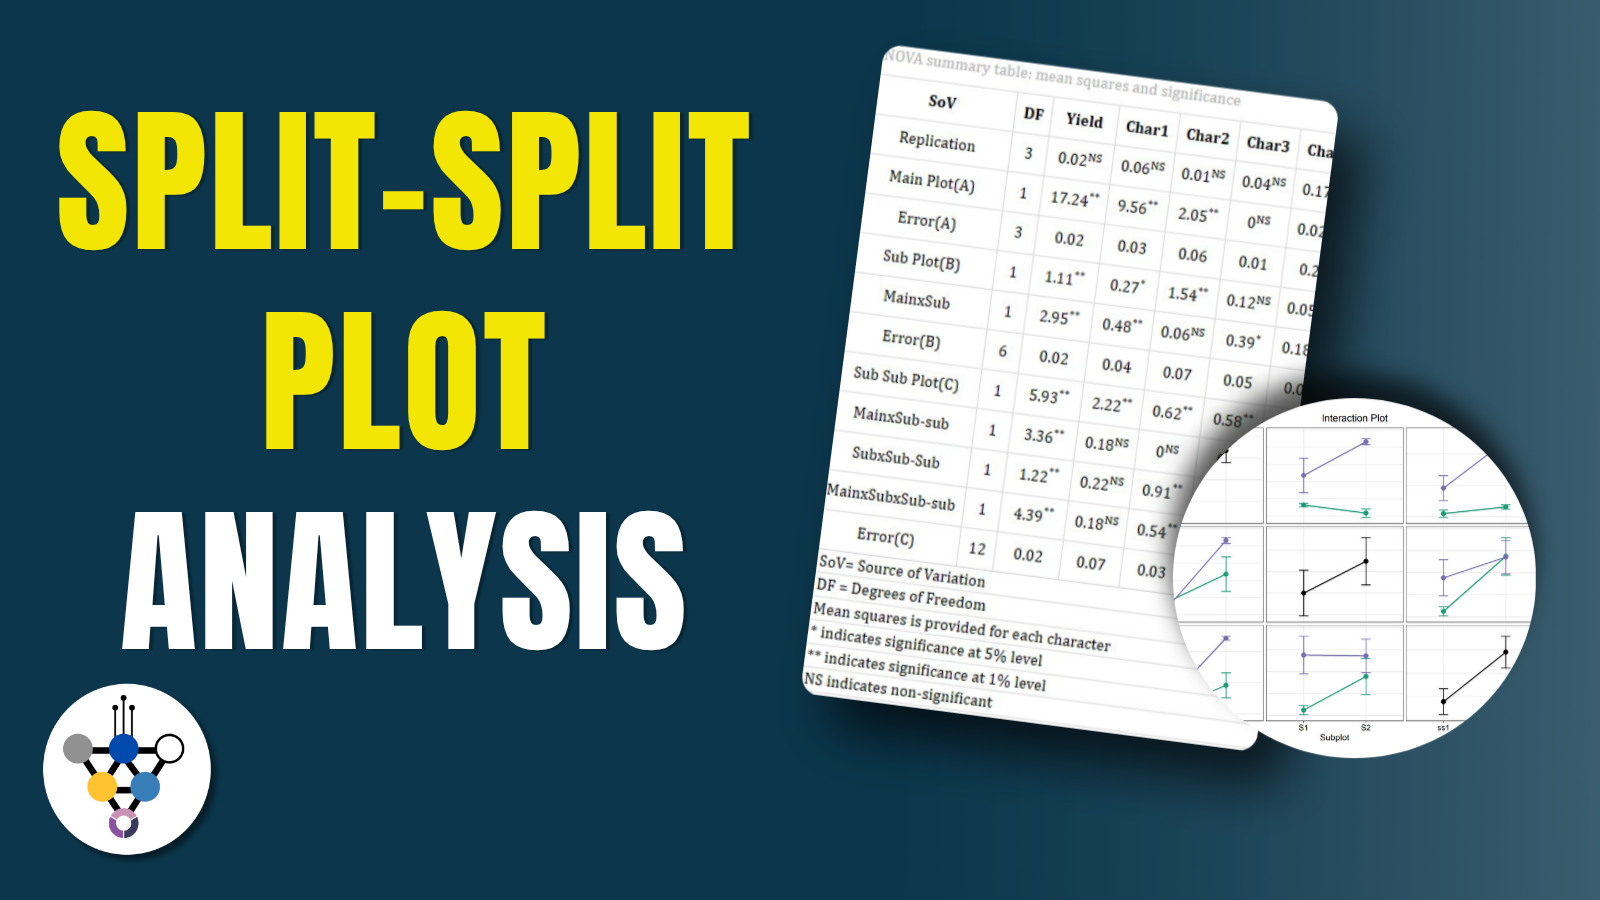
Split-Split Plot Design
A split-split-plot design handles three factors when they must be applied to progressively smaller experimental units, splitting the experiment into whole-plot, subplot, and sub-subplot strata with an error term for each. This tutorial explains where the design comes from, why it needs several different critical differences, and how to run the whole analysis in RAISINS… Read more …
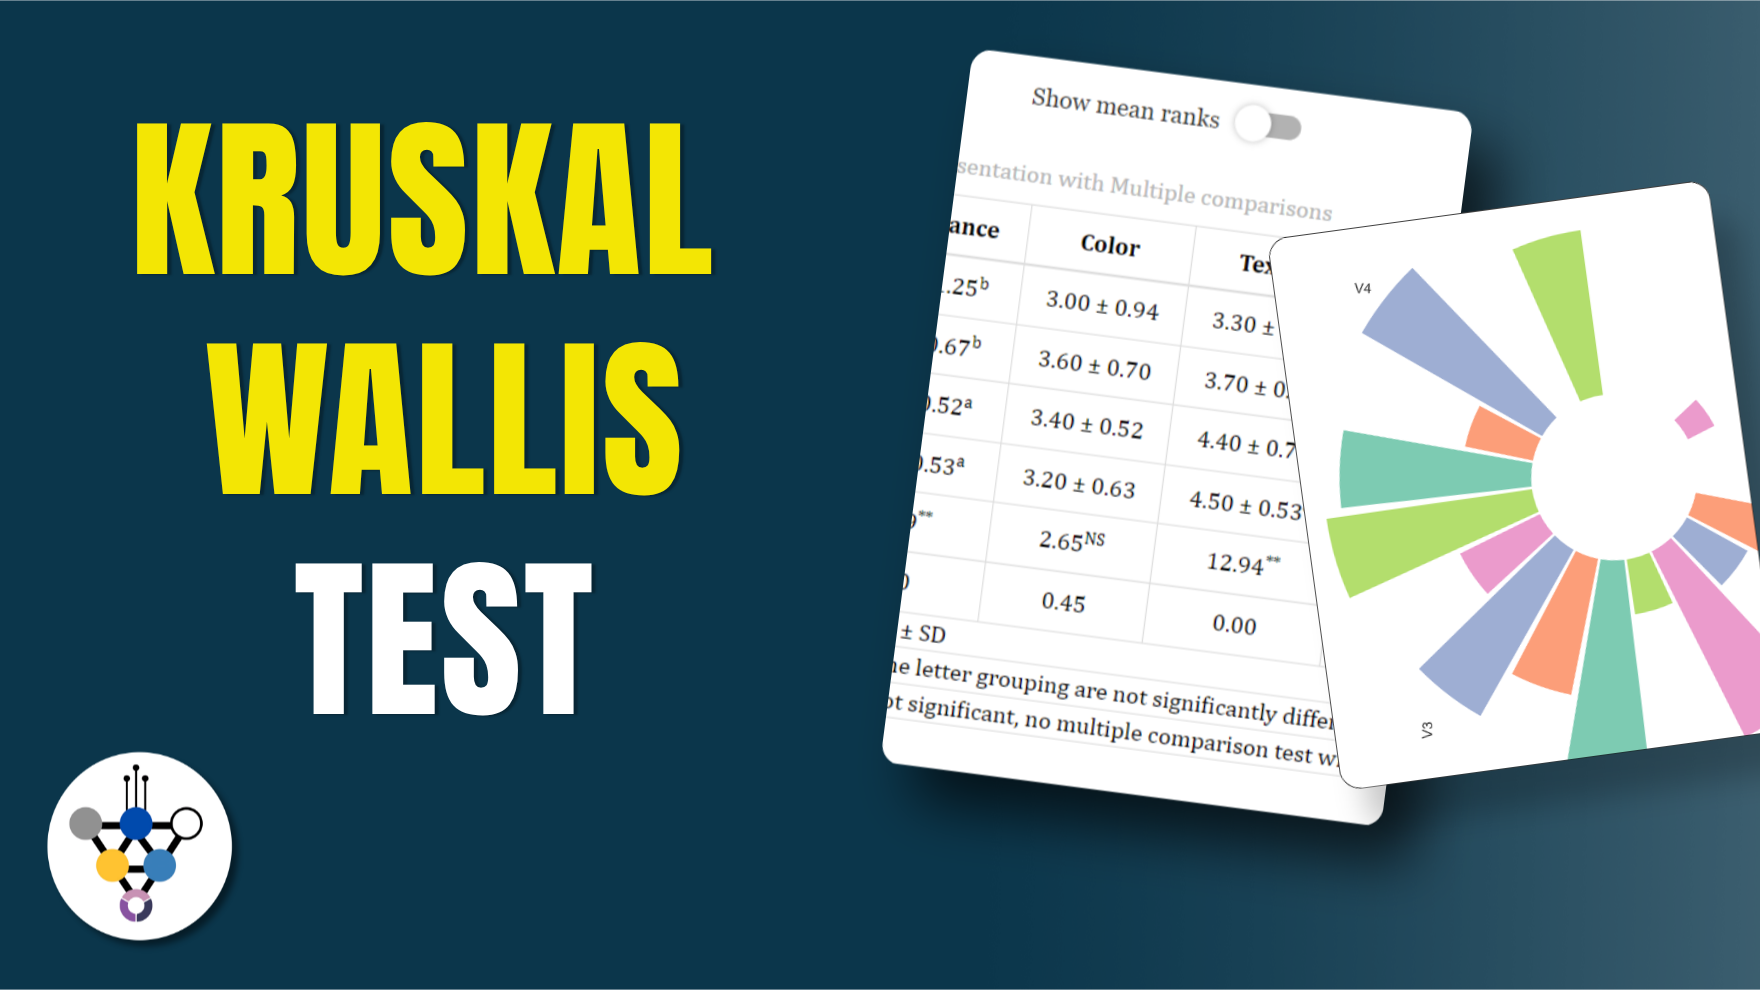
Kruskal-Wallis Test
The Kruskal-Wallis test compares three or more groups on a numeric response without assuming normality or equal variances, working on ranks instead of raw values. This tutorial explains the H-statistic, why a significant result only means “some group differs,” how Dunn’s test and LSD post-hoc comparisons and compact letter grouping pin down which groups differ, and how to run the whole analysis code-free… Read more …
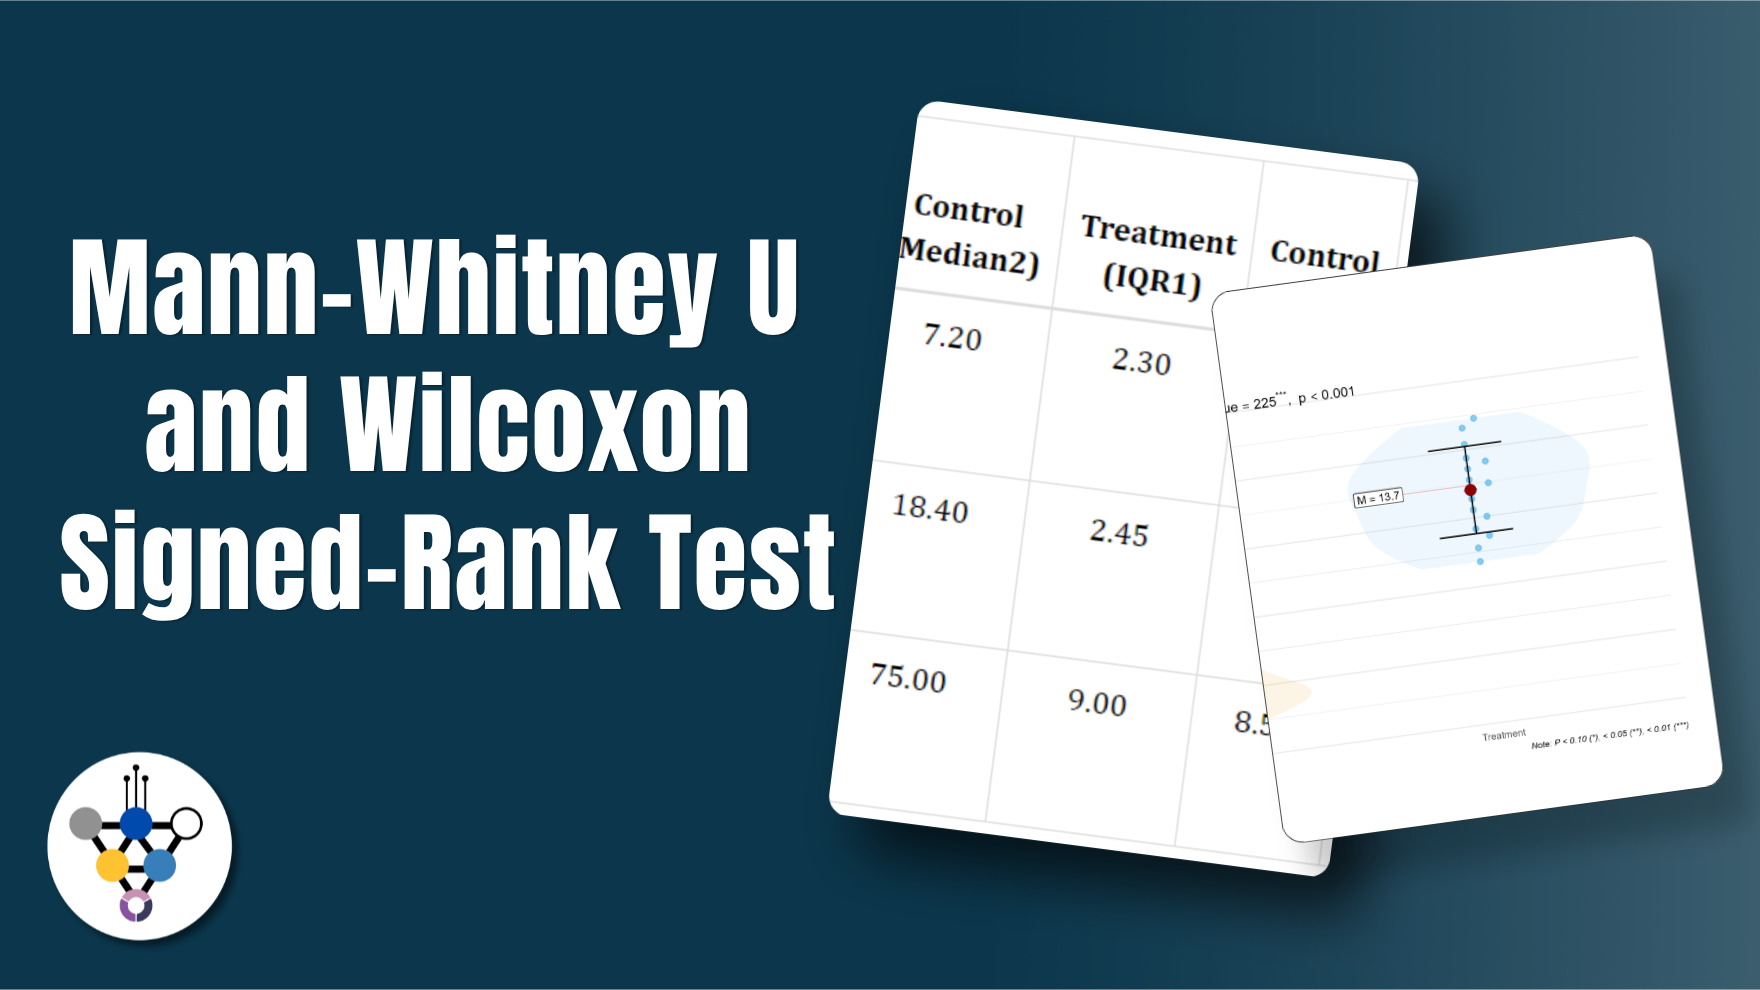
Mann-Whitney U and Wilcoxon Signed-Rank Test
The Mann-Whitney U test compares two groups on a numeric response without assuming normality, working on ranks instead of raw values; the Wilcoxon Signed-Rank test does the same for paired measurements. This tutorial explains the W and V statistics, how to choose between the two tests, what the Hodges-Lehmann interval tells you, and how to run the whole analysis code-free… Read more …